
Here is a short tutorial about GBD for beginners. GDB is the powerful command line based debugger available with Linux. If you usually use a visual debugger like the one integrated in Visual Studio, a command line debugger like GDB can be a bit… frightening. But actually it’s quite easy to step into your code with it. Few commands are necessary to quickly start using GDB for basic debugging tasks.
First thing, to debug your program, you have to compile it with the -g option to include debugging information (debugging symbols):
> g++ -g ....
Once your program has been compiled and linked, you can launch your program with GDB:
> gdb -q your_program
The -q option allows to hide this header message:
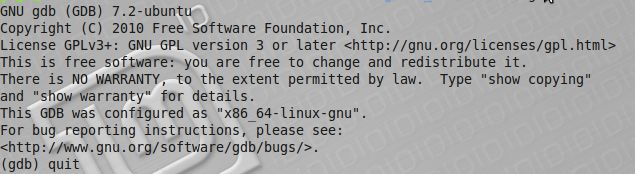
Now we are in GDB but the program is not running again. If you want to run your program, just type:
(gdb) run
The run command is the equivalent of F5 in Visual Studio. GDB will run your program until the end or until the first crash / segmentation fault.
You can set a break point by specifying the line number or a function name:
(gdb) break line_number
(gdb) break function_name
You can set breakpoints before the command run, or during the debugging.
In the following screenshot, I set a break point at line 38:
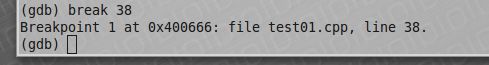
Once you reach the break point, use s or n commands to step in your code:
– n: run the instruction (F10 in Visual Studio)
– s: step into the current function (F11 in Visual Studio)
In the following screenshot, the execution is stopped at the break point line 38:
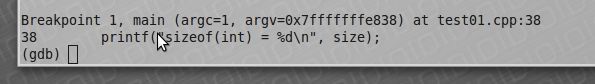
To continue until the next break point, use the c command (F5 in Visual Studio).
To display the value of a variable, the p command is available:
(gdb) p my_variable
In the following screenshot, I want to know the value of the variable named size:
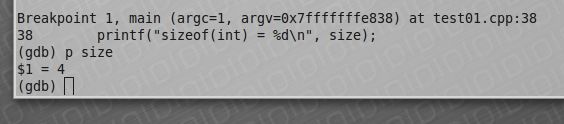
To stop the debugging:
(gdb) kill
To quit GDB:
(gdb) quit
References:
Yes GDB is very powerful. It is amazing what you can with GDB with plugins too.
You can use it to debug CUDA and OpenCL code too (with the right vendor plugins).
Yep, I’m currently a newbie with gdb but I can already feel the power of this tool