
|
|
Downloads |
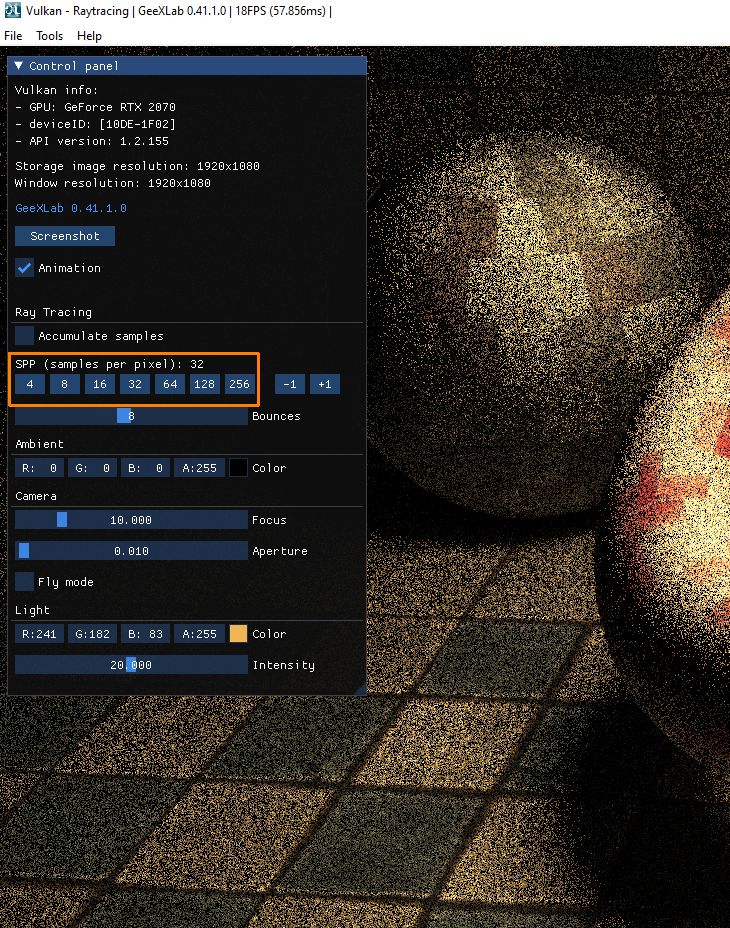
Want to play with ray tracing? Here is a Vulkan ray tracing demo made with GeeXLab that implements a path tracer. The demo is available on Windows and Linux. A path tracer is an interesting benchmark because we can easily increase the workload of ray tracing accelerator units by launching more rays per pixel.
By default, the demo starts with 16 samples per pixel (or 16 SPP): for each pixel on the screen, 16 rays are launched with small random variation on the direction of the ray (at launch or after a bounce). The rule is simple: the more samples, the better the final image.
The demo renders the ray traced scene in a full HD image (1920×1080 pixels). There is no denoiser (it’s not the purpose of the demo). The purpose of the demo is to benchmark the performance of the ray tracing units of GeForce RTX and Radeon RX 6000 GPUs. You can choose the SPP: 16, 32, 64, or 128. 128 SPP is reserved for powerful GPUs. I also added a 256 SPP for fun but I didn’t included it in the benchmark. If your GPU is able to run the 256 SPP test, post your results in the comments section.
I tested the demo on Windows 10 64-bit with the following graphics cards:
– GeForce RTX 2070
– GeForce RTX 2080
– GeForce RTX 3060 Ti
– Radeon RX 6800 XT
For Radeon GPUs, Windows 10 64-bit v2009 (20H2) and latest Radeon Adrenalin 21.2.2 drivers are required. For GeForce GPUs, I tested with latest GeForce 461.40.
I also tested the demo on Linux Mint 20.1 64-bit with the following graphics cards:
– GeForce RTX 2080
– GeForce RTX 3060 Ti
– GeForce GTX 1060 6GB (yes it’s a GTX!)
Performances on Linux (with driver 460.32.03) are identical to Windows ones so I will only show performances on Windows in comparative tables.
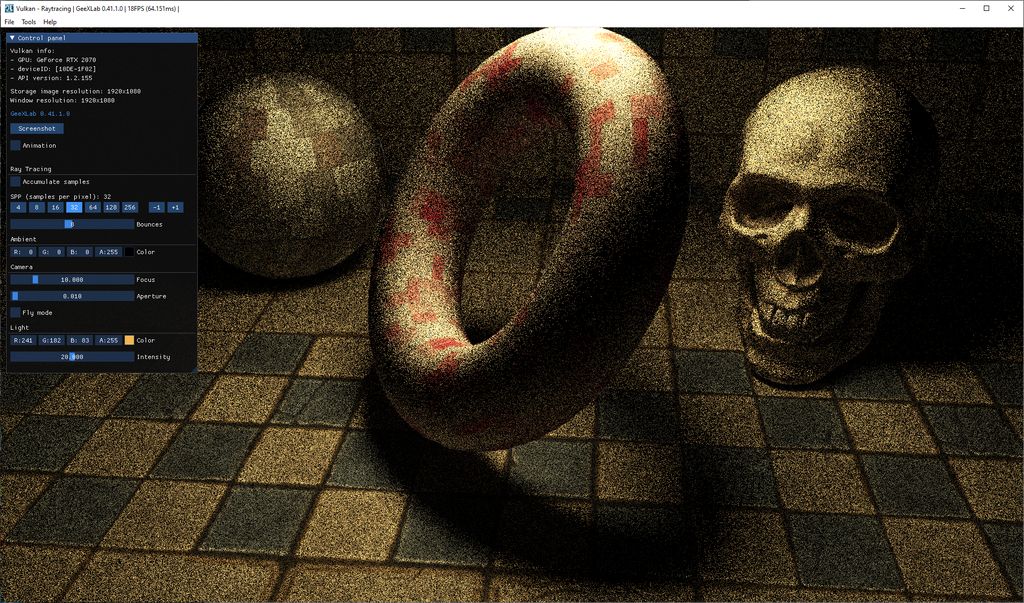
The demo (32 SPP):
| Test System | |
|---|---|
| CPU | Intel Core i7-8700K @ 3.7GHz |
| Motherboard | GIGABYTE Z390 Gaming X |
| Memory | 16GB DDR4 Corsair Vengeance LED @ 3000MHz |
| PSU | Corsair AX860i |
| Storage | Samsung 840 Pro 256GB SSD |
| OS | Windows 10 v2009 64-bit |
Test 1: 16 SPP

| 49 FPS ASUS ROG Strix GeForce RTX 2080 – GeForce 461.40 |
| 45 FPS GIGABYTE GeForce RTX 3060 Ti Gaming OC 8G – GeForce 461.40 |
| 36 FPS MSI GeForce RTX 2070 Ventus – GeForce 460.89 |
| 26 FPS ASUS TUF Radeon RX 6800 XT OC 16GB – Adrenalin 21.2.2 |
| 3 FPS ASUS Strix GeForce GTX 1080 OC 8GB – GeForce 461.40 |
| 2 FPS EVGA GeForce GTX 1060 6GB – GeForce 460.32.03 on Linux |
Test 2: 32 SPP

| 27 FPS ASUS ROG Strix GeForce RTX 2080 – GeForce 461.40 |
| 25 FPS GIGABYTE GeForce RTX 3060 Ti Gaming OC 8G – GeForce 461.40 |
| 19 FPS MSI GeForce RTX 2070 Ventus – GeForce 460.89 |
| 14 FPS ASUS TUF Radeon RX 6800 XT OC 16GB – Adrenalin 21.2.2 |
Test 3: 64 SPP

| 14 FPS ASUS ROG Strix GeForce RTX 2080 – GeForce 461.40 |
| 13 FPS GIGABYTE GeForce RTX 3060 Ti Gaming OC 8G – GeForce 461.40 |
| 10 FPS MSI GeForce RTX 2070 Ventus – GeForce 460.89 |
| 7 FPS ASUS TUF Radeon RX 6800 XT OC 16GB – Adrenalin 21.2.2 |
Test 4: 128 SPP

| 7 FPS ASUS ROG Strix GeForce RTX 2080 – GeForce 461.40 |
| 7 FPS GIGABYTE GeForce RTX 3060 Ti Gaming OC 8G – GeForce 461.40 |
| 5 FPS MSI GeForce RTX 2070 Ventus – GeForce 460.89 |
| 4 FPS ASUS TUF Radeon RX 6800 XT OC 16GB – Adrenalin 21.2.2 |
Conclusion
This quick test shows that Radeon RX 6000 (RDNA 2) are (currently) behind GeForce RTX 20 or 30. Possible causes of this slowness: my glsl code (in raygen or hit shaders) and/or Radeon drivers and/or ray accelerator units and/or the weather…
The GeForce RTX 2080 is still a good choice if you can’t find a RTX 30. If you have a RTX 3080, RTX 3090 or a RX 6900 XT, post your scores.
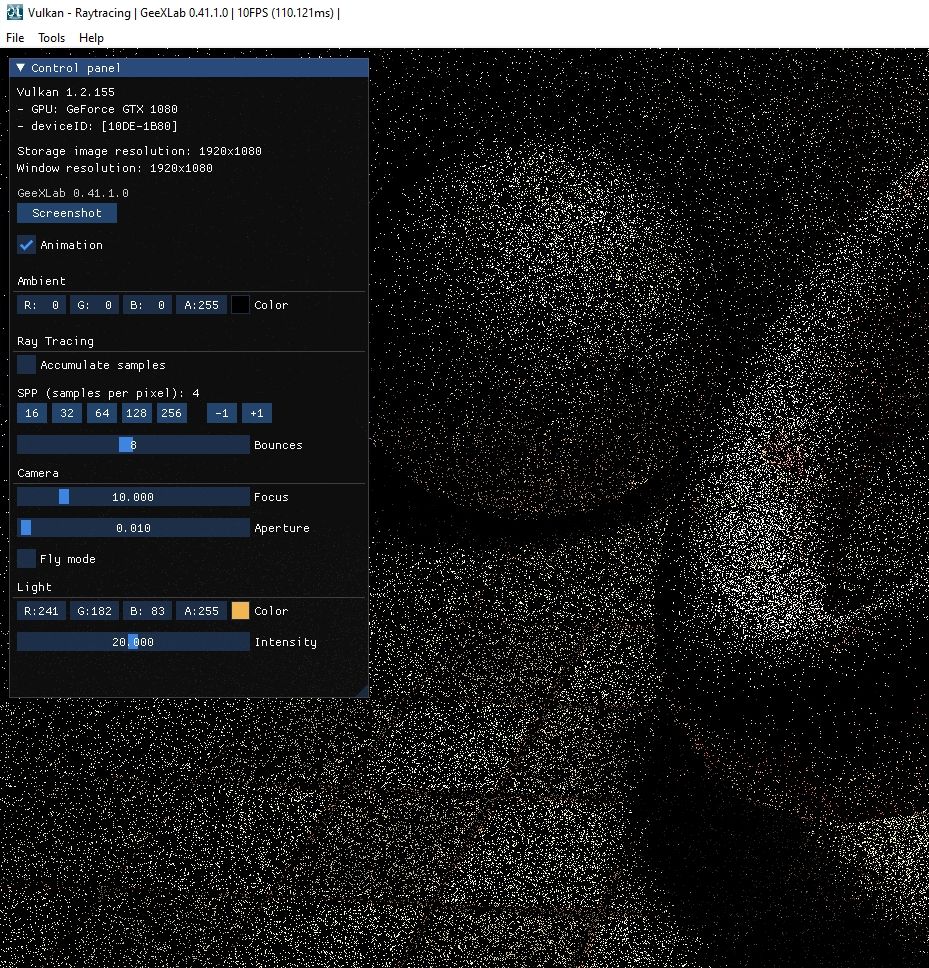
The thing that surprised me was to see the ray tracing demo running on a GeForce GTX. Indeed NVIDIA added ray tracing support to GeForce GTX (see this news) but honestly, at this moment, it was a detail and I no longer remember it. I tested the path tracer on the GeForce GTX 1080 with 4 SPP and the GPU managed to run at 10 FPS! For comparison, a GeForce RTX 2070 runs the demo with 4 SPP at 115 FPS.
Without a denoiser, we have to launch a lot of rays to get a noiseless image. Here is the scene rendered with 4096 SPP (accumulation is enabled in that case!):

When GPUs will be able to launch so many rays per frame (full HD resolution) at interactive framerates, real time ray tracing will be a reality. But using some optimizations (size of the ray traced image + upscaling, number of samples, denoiser, better shader code, etc) we can do very cool graphics today with ray tracing with recent GeForce RTX or Radeon RX 6000.
Tested on GTX 1660 Super – OCed +150 MHz, Linux Mint 20.1
4 FPS @ 16 SPP
my 1650 (non super) unfortunatley refused to start the benchmark 🙁
GPU: RTX3090 Aorus XTREME
CPU R9 5900X
Results:
SPP | FPS | GPU %
16 | 100 | 90
32 | 47 | 97
64 | 27 | 99-100
128 | 14 |99-100
256| 7 | 100
GPU % references the value shown in by “Graphics_1” in Task Manager
Configuration:
– Graphics: MSI GeForce RTX 3080 GAMING X TRIO (Driver 460.89, API 1.2.155)
– CPU: Intel I9-9900K
– Motherboard: GIGABYTE Z390 Gaming X
– Memory: 32GB DDR4-3000 Corsair Vengeance LPX
– Storage: Samsung SSD 970 EVO 1TB NVME
– PSU: beQuiet Straight Power 11
– OS: Windows 10 x64 20H2 19042.804
Results:
16 SPP: 75fps
32 SPP: 40fps
64 SPP: 22fps
128 SPP: 12fps
256 SPP: 6fps
Configuration:
– Graphics: MSI GeForce RTX 3090 Ventus 3X (Driver 461.81)
– CPU: AMD Threadripper 3960X
– Motherboard: ASRock Taichi TRX40
– Memory: 64 GB DDR4-3600 G.SKill
– Storage: Samsung SSD 980 Pro 2TB NVME
– PSU: beQuiet Dark Power Pro 1200 W
– OS: Windows 10 x64 20H2
Results:
16 SPP: 97 fps (GPU-Utilization 14%)
32 SPP: 50 fps (GPU-Utilization 16%)
64 SPP: 27 fps (GPU-Utilization 17%)
128 SPP: 14 fps (GPU-Utilization 18%
256 SPP: 8 fps (GPU-Utilization up to 30%)
Unfortunately, the benchmark is extremely limited by the CPU!
Thanks for your scores.
Question: how do you measure the GPU usage?
Looks like you use Windows task manager. In that case you have to look at the Graphics_1 sensor, not the 3D one.
Configuration:
– Graphics: GIGABYTE GeForce AORUS RTX 3080 XTREME 10G (Driver 471.41, Vulkan 1.2.175, DX 12.1, OpenGL 4.6)
– CPU: AMD Ryzen 5 3600
– Motherboard: ASUS STRIX X590-F Gaming
– Memory: G.Skill Trident Z Neo 32GB (2x16GB) DDR4 3600 CL16
– Storage: Samsung SSD 970 EVO PLUS, 500GB M.2 NVMe
– PSU: Seasonic Focus Plus Platinum 750 W
– OS: Windows 10 Home x64 21H1 19043.1110 (Windows Feature Experience Pack 120.2212.3530.0)
Results – MAX fps with non OC mod (with OC it would be a bit more):
16 SPP: 98 fps
32 SPP: 50 fps
64 SPP: 25 fps
128 SPP: 13 fps
256 SPP: 7 fps
This Benchmark ver. 2021.2.18.0 used CPU between 3% – 15% (Benchmark is currently not limited by CPU performance).