Article index
- 1 – Overview
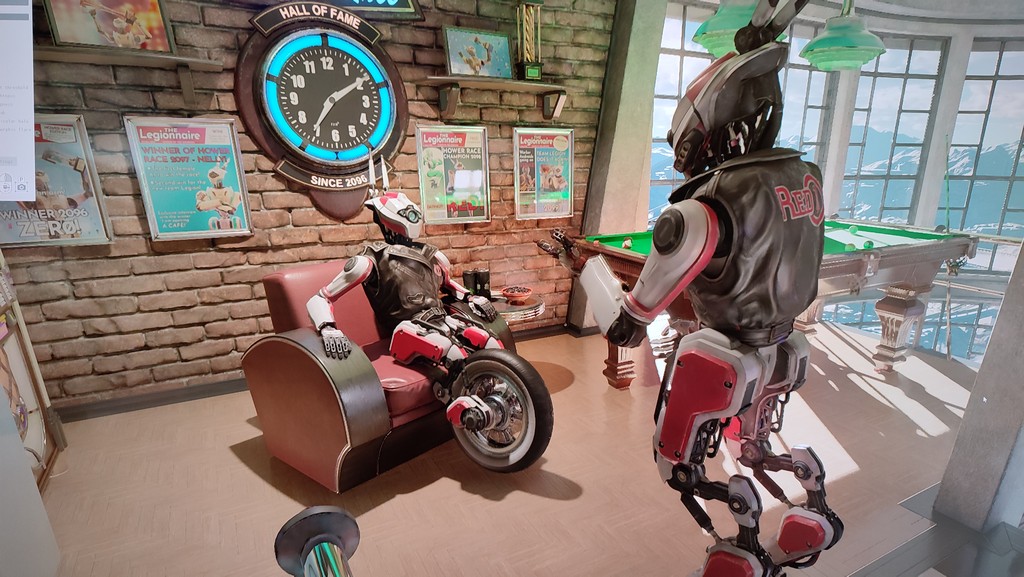
- 2 – Gallery
- 3 – GPU information
- 4 – Benchmarks
- 4.1 – 3DMark FireStrike
- 4.2 – 3DMark TimeSpy
- 4.3 – 3DMark Port Royal
- 4.4 – 3DMark DX Raytracing Test
- 4.5 – 3DMark Speed Way
- 4.6 – Unigine Superposition
- 4.7 – FurMark
- 4.8 – Rhodium LC
- 5 – Burn-in Test
- 6 – Conclusion
1 – Overview
The GeForce RTX 4070 Ti is the third member of the RTX 40 family and has been launched in the first days of 2023. This card was originally branded as a RTX 4080 12GB but NVIDIA unlaunched this RTX 4080 and rebranded it as the RTX 4070 Ti.
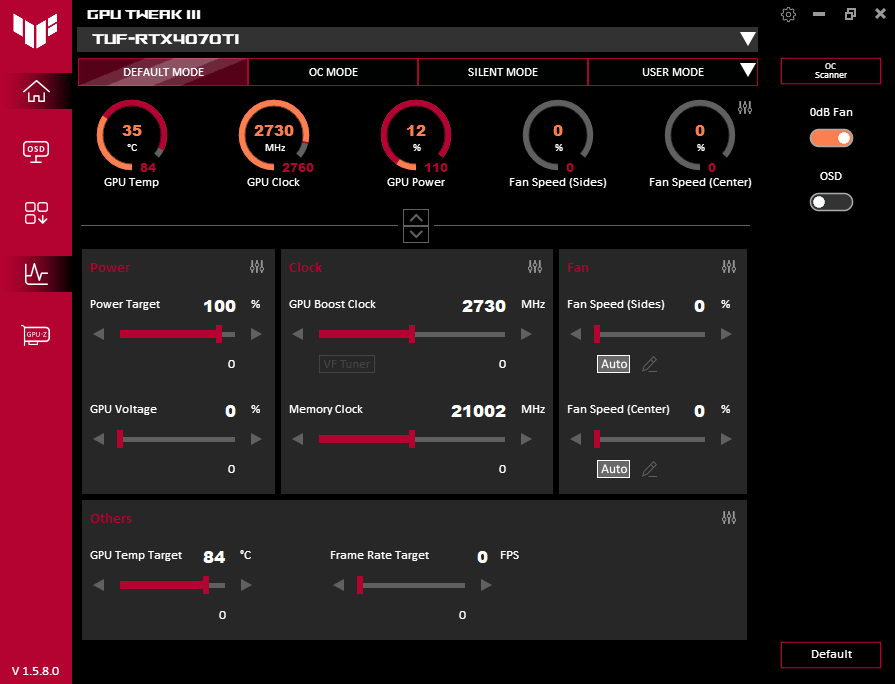
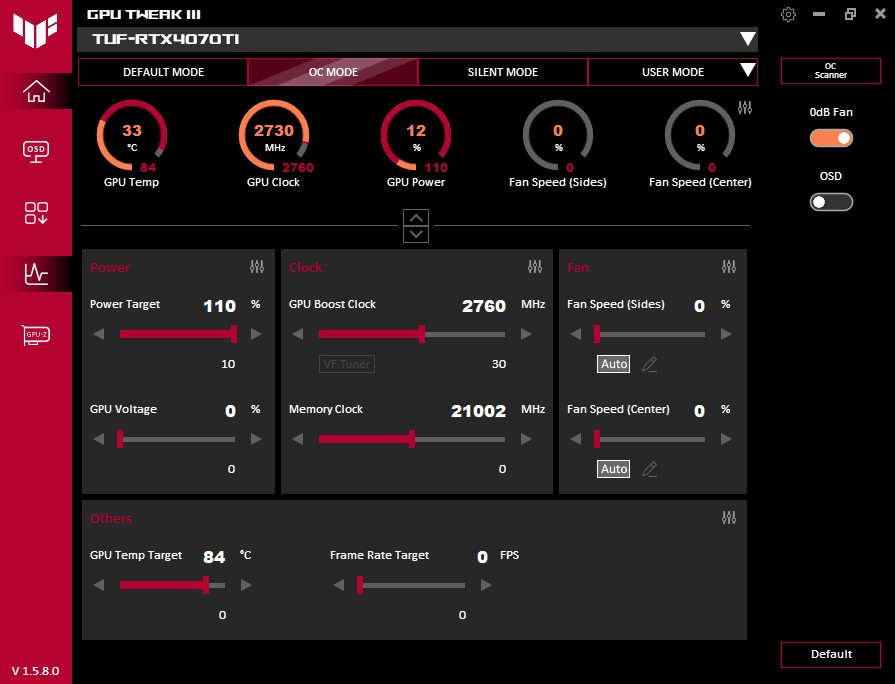
The RTX 4070 Ti is based on the AD104 GPU (Ada Lovelace architecture) and packs 7680 shader processors (or CUDA cores). This TUF model has a factory-overclocked GPU: OC mode up to 2760 MHz and default mode up to 2730 MHz (RTX 40 Ti reference board has a boost clock speed of 2610 MHz). This factory OC brings an immediate gain of +6%. The RTX 4070 Ti embarks 12GB of GDDR6X video memory that talks with the GPU on a 192-bit bus. The RTX 4070 Ti reference board can pull up to 285W and you can expect a bit more for this TUF RTX 4070 Ti (see the burn-in test section for more details).
The ASUS TUF RTX 4070 Ti is a 3.25-slot graphics card and its mass is 1.320kg.
More marketing explanations and specifications can be found on the ASUS TUF RTX 4070 Ti homepage.
2 – Gallery
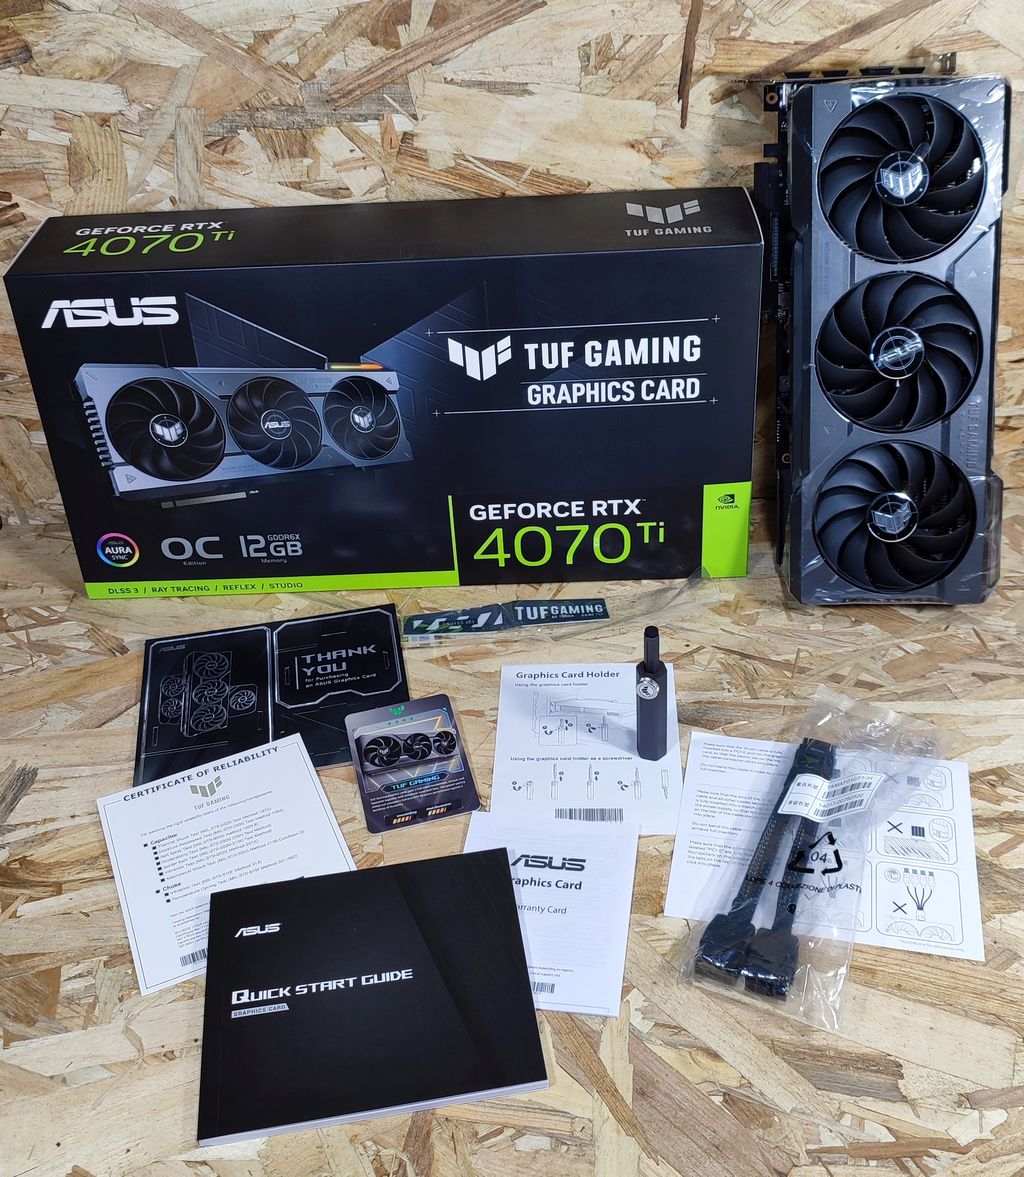
The bundle includes the following items:
– the TUF RTX 4070 Ti
– a certificate of reliability (military tests!)
– an installation guide
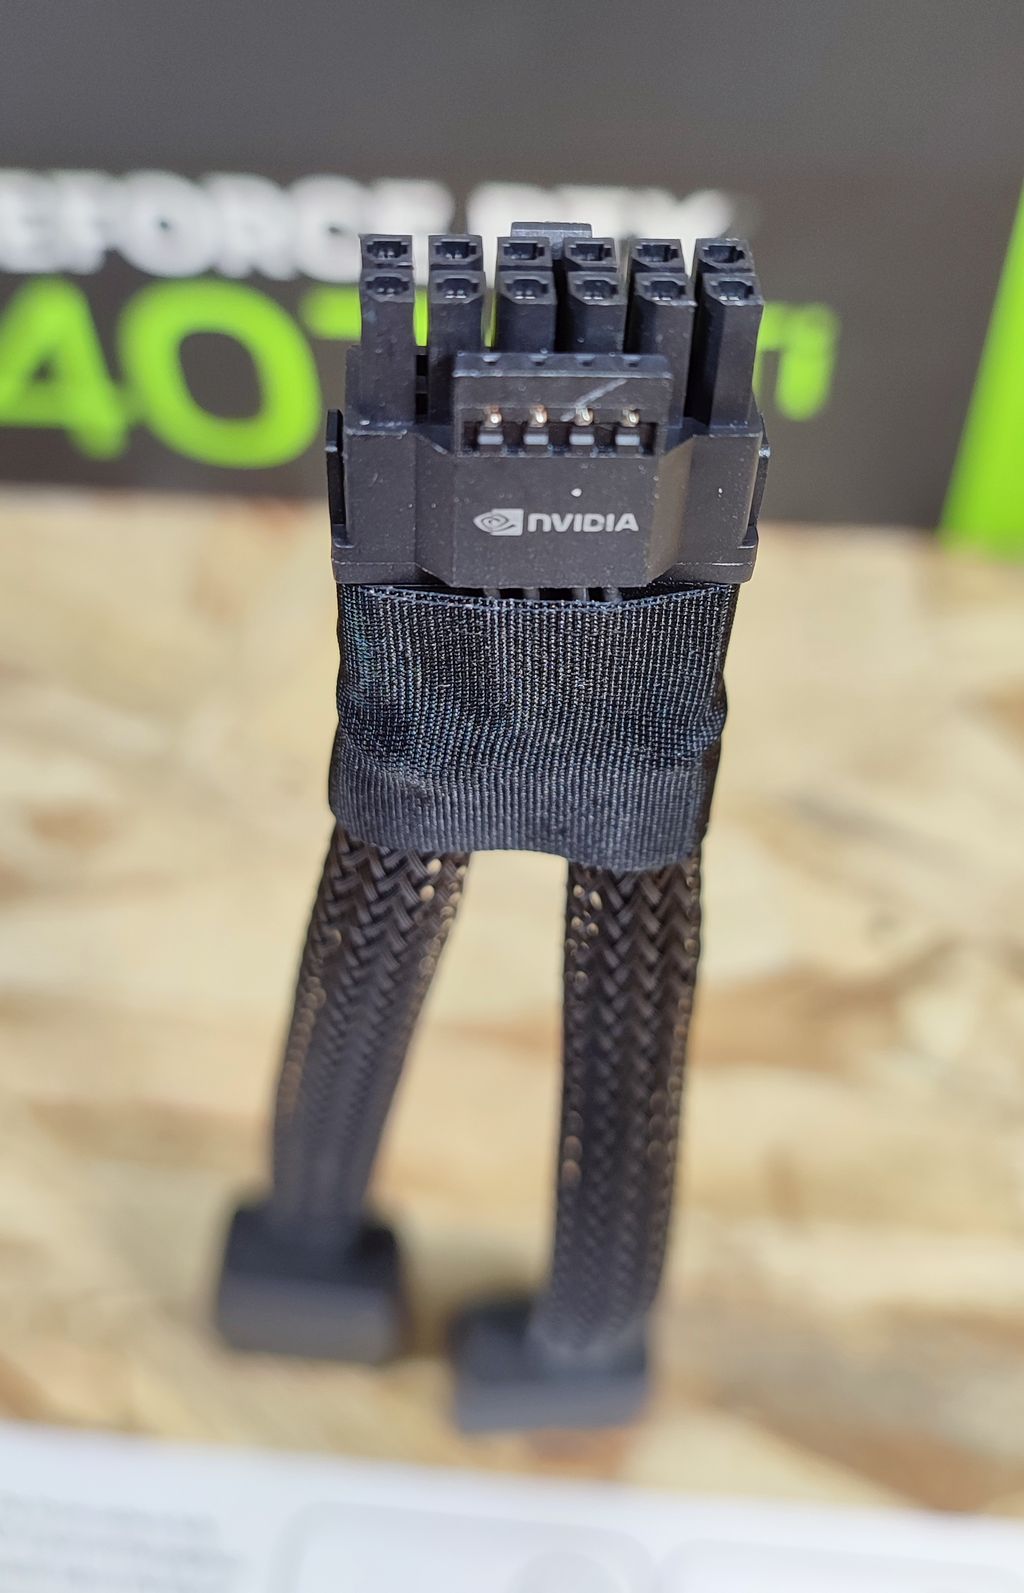
– a two 8-pin to one 16-pin power adapter
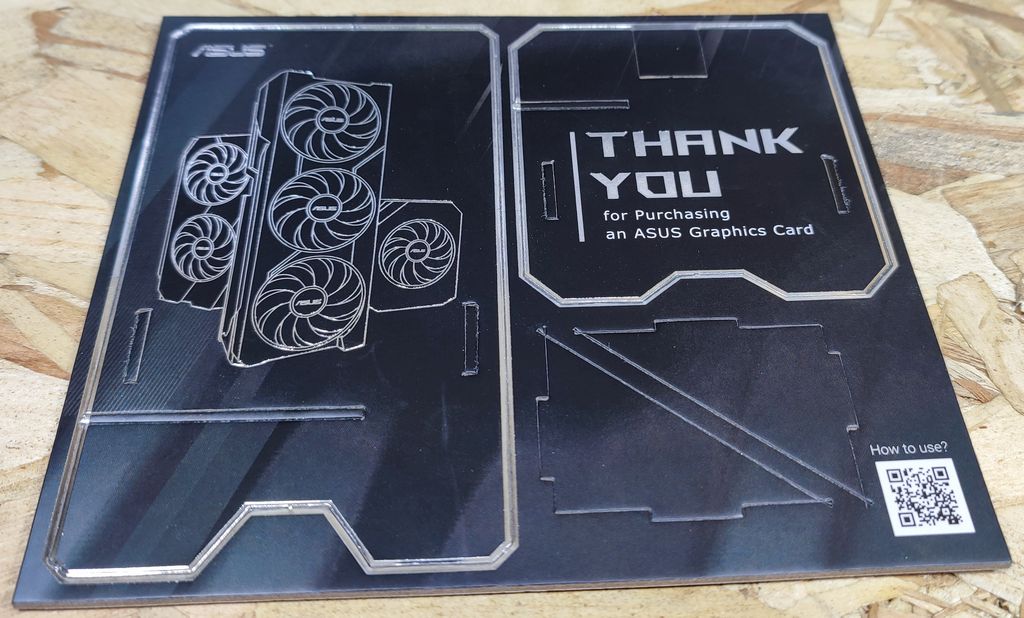
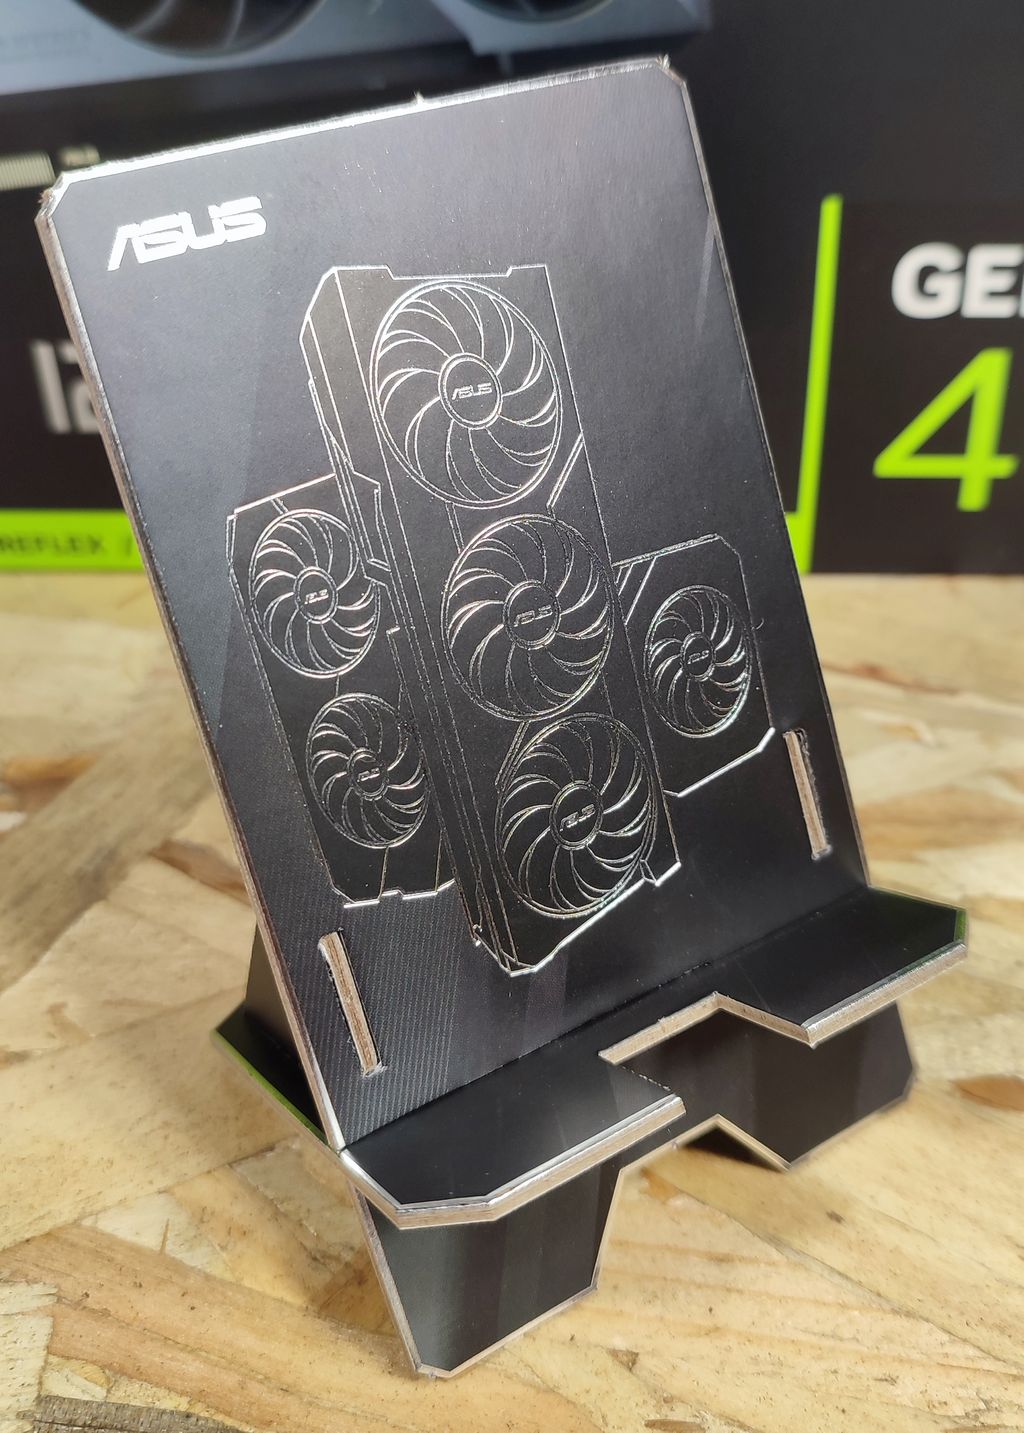
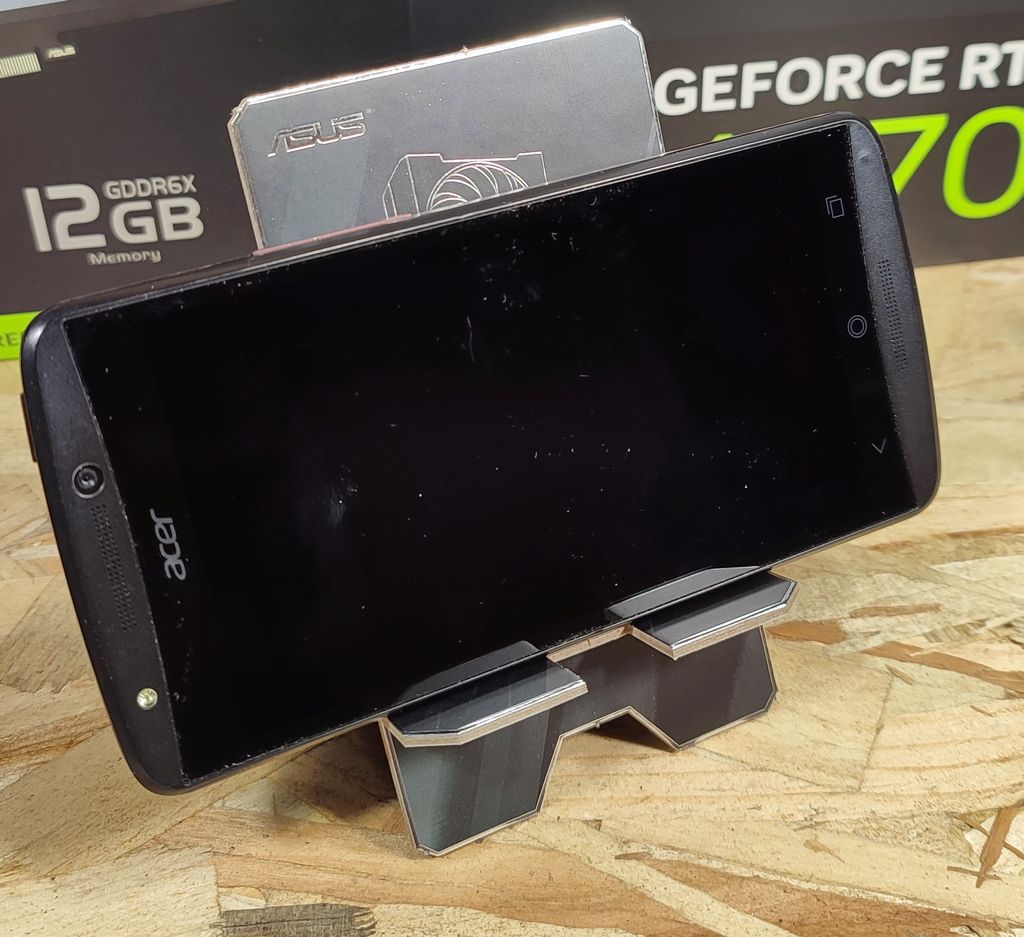
– a mobile phone holder
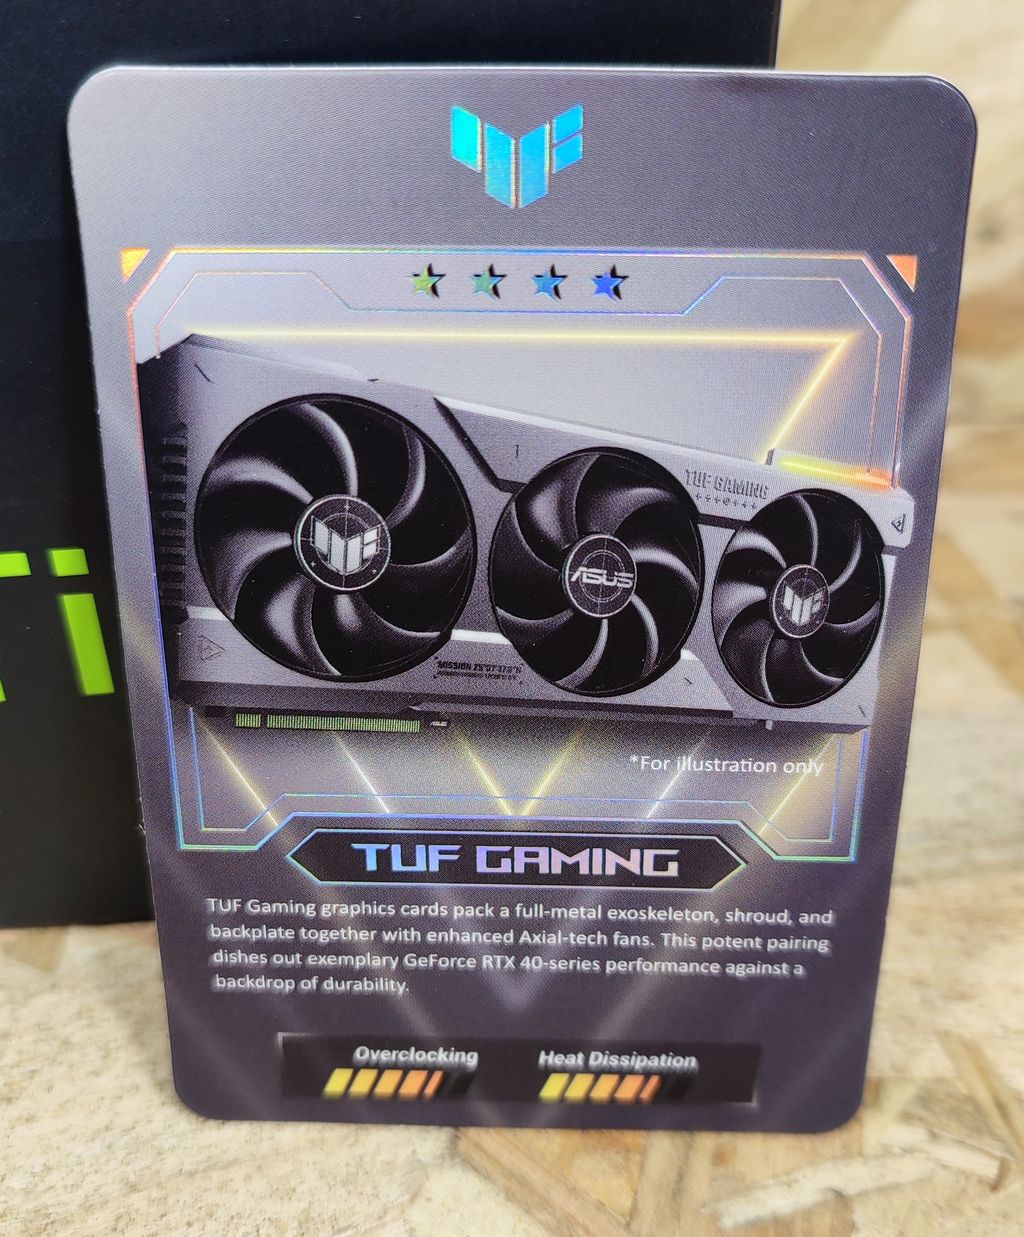
– a collection TUF Gaming card (in cardboard)
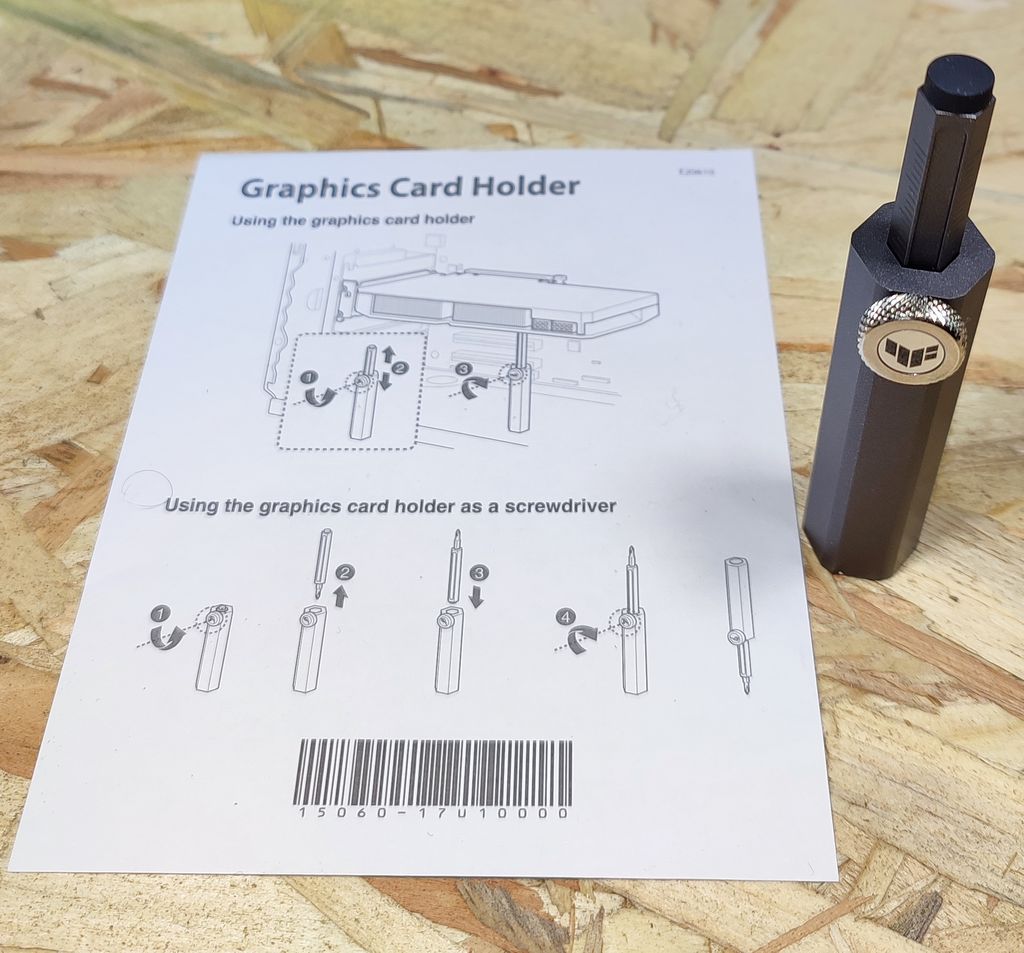
– a graphics card holder (the TUF RTX 4070 Ti is heavy…)
– a TUF velcro hook and loop

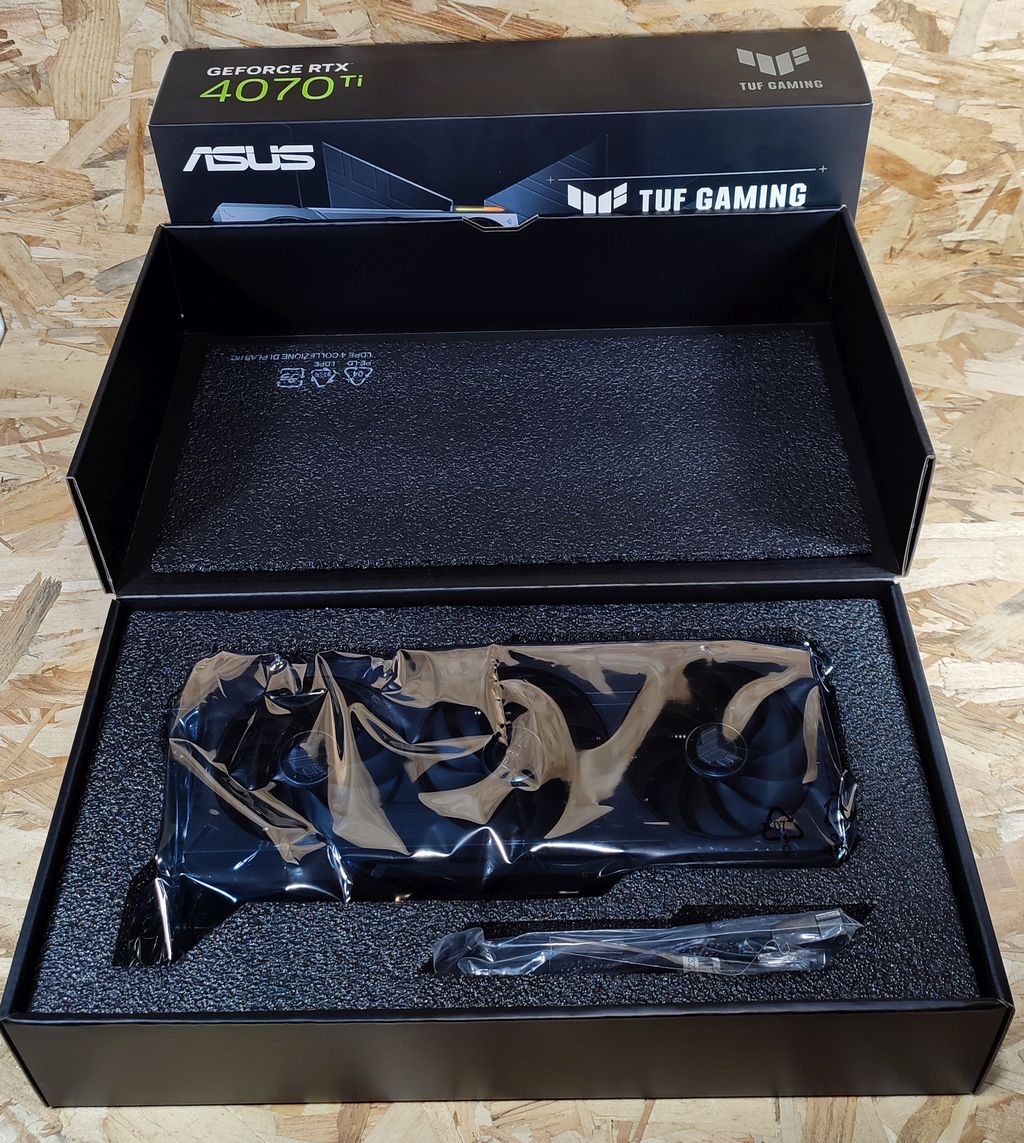
The bundle items:
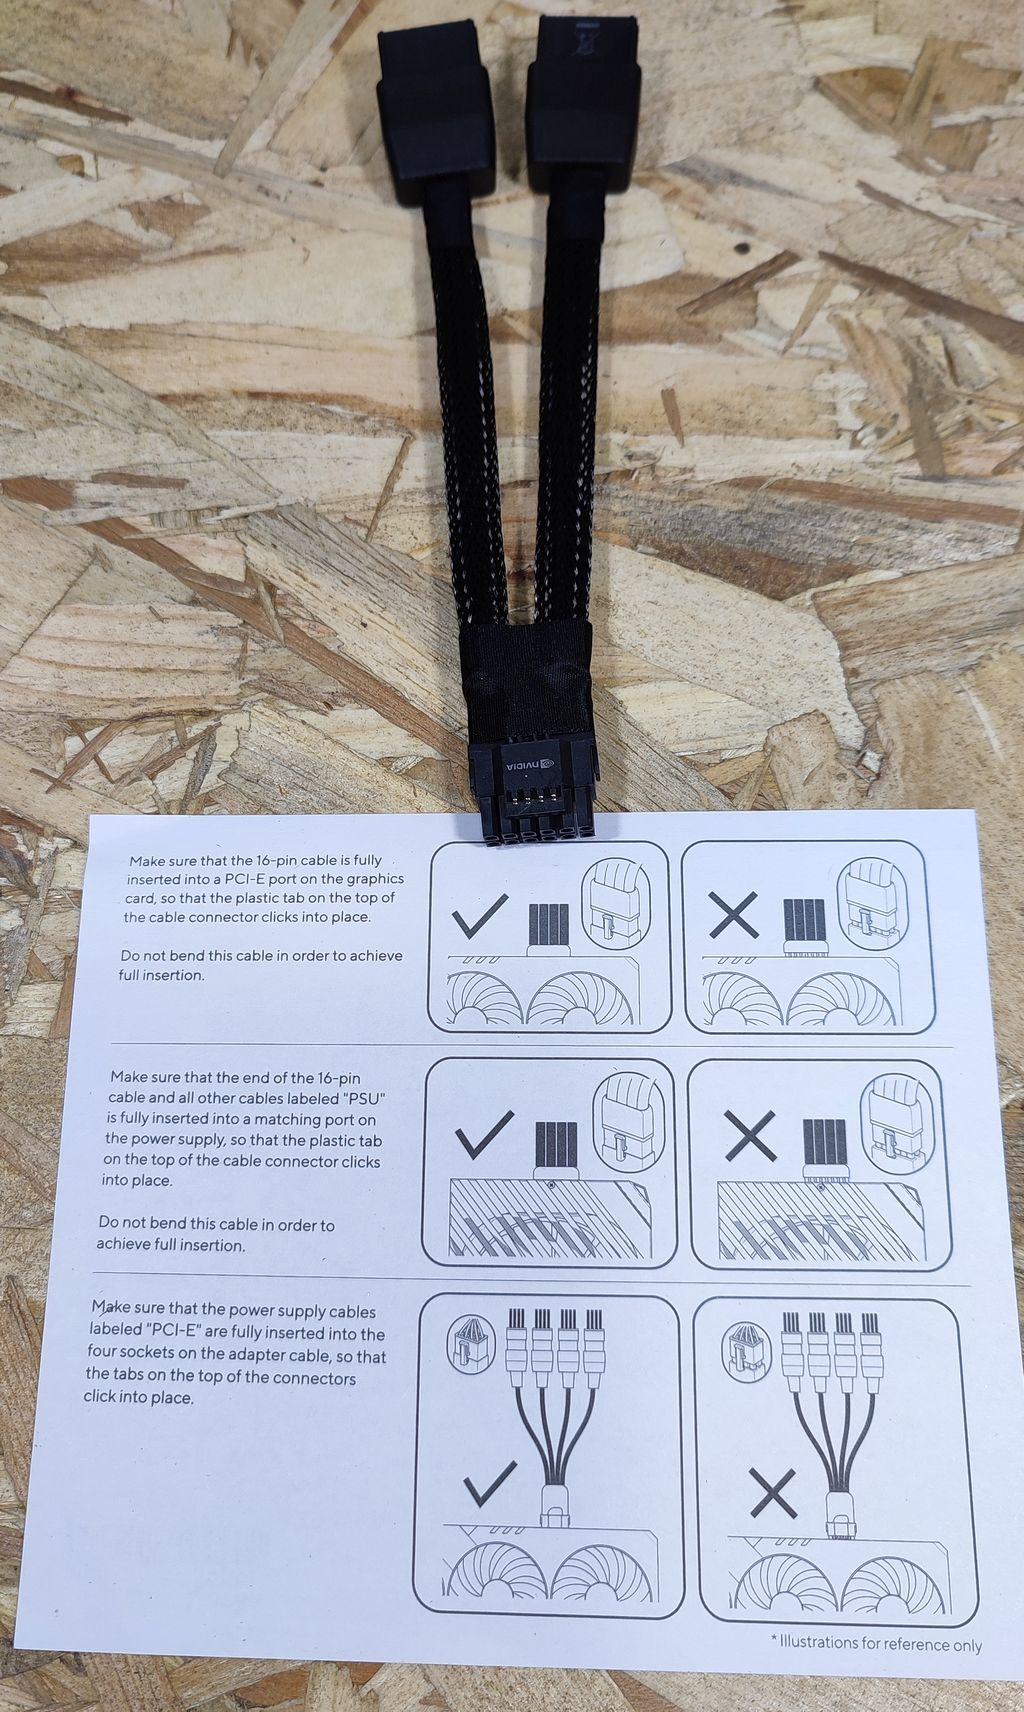
The dual 8-pin to 16-pin cable adapter:
The collection TUF Gaming card:
The mobile phone holder. Handy gadget, it’s easy to mount and is stable. Now my phone has a real place in the mess of my desk.
The graphics card holder. When mounting horizontally in a case, this gadget is useful to support the mass of the TUF RTX 4070 Ti: 1.320kg. Thanks to the screw, you can tune the height of the holder.
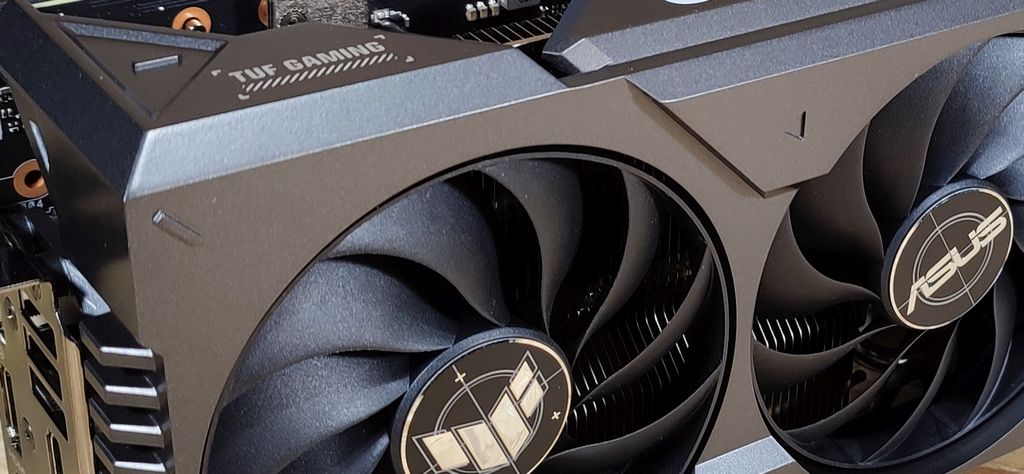
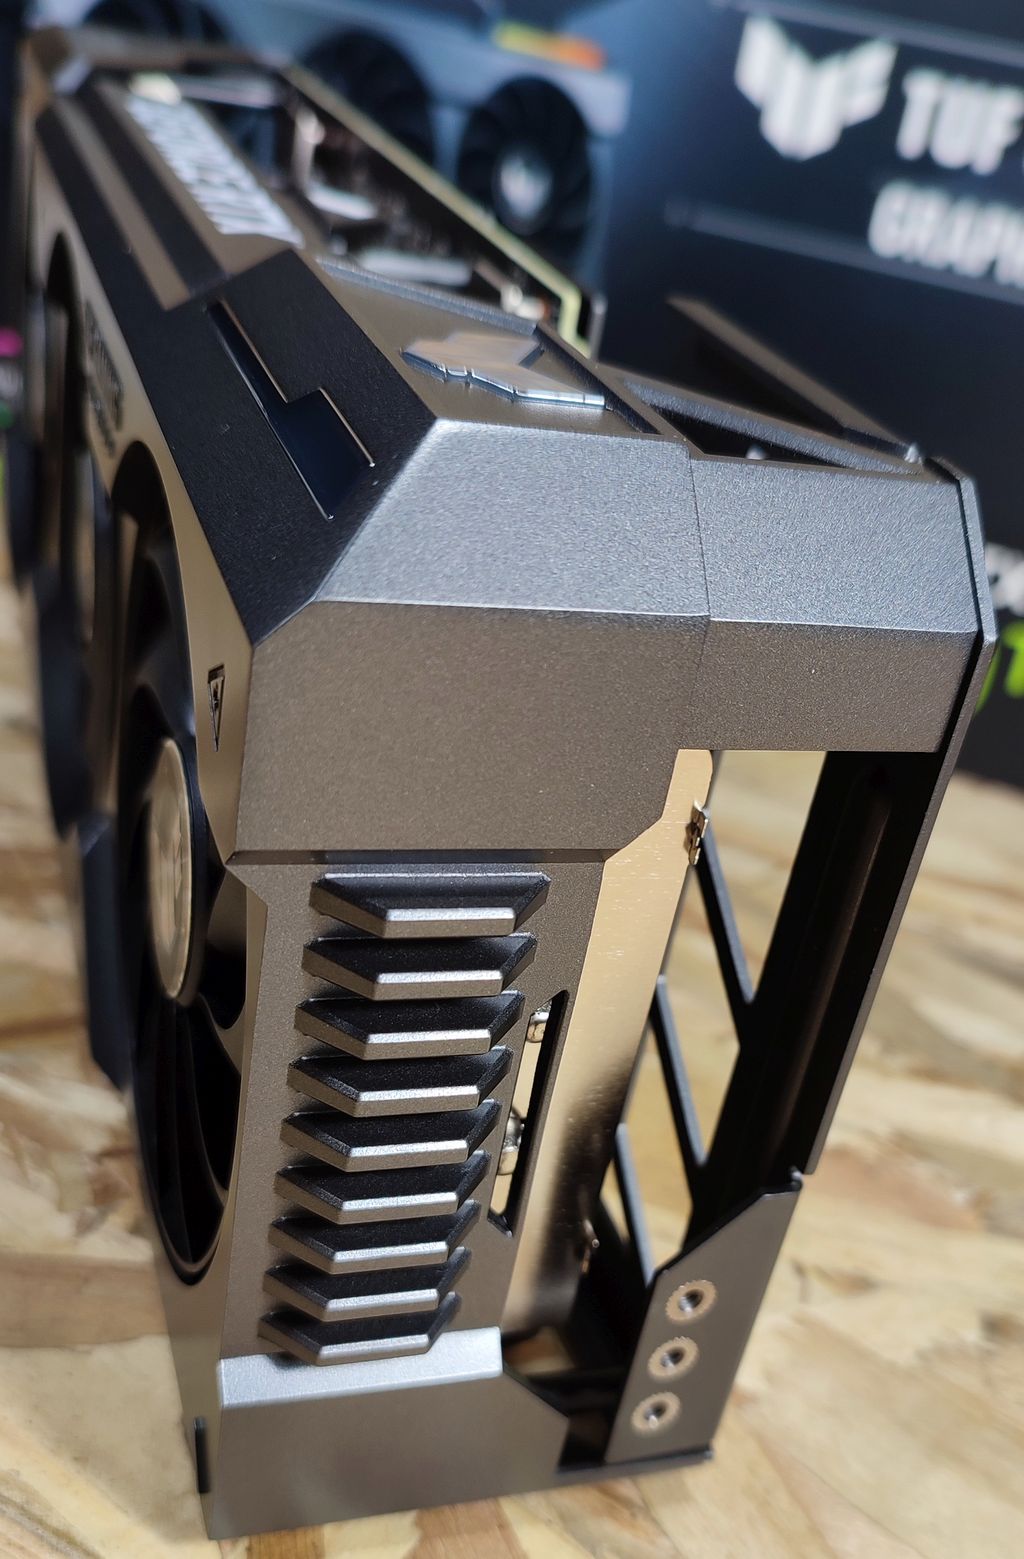
The graphics card with a 3.25-slot design. I really love the industrial look of the card.

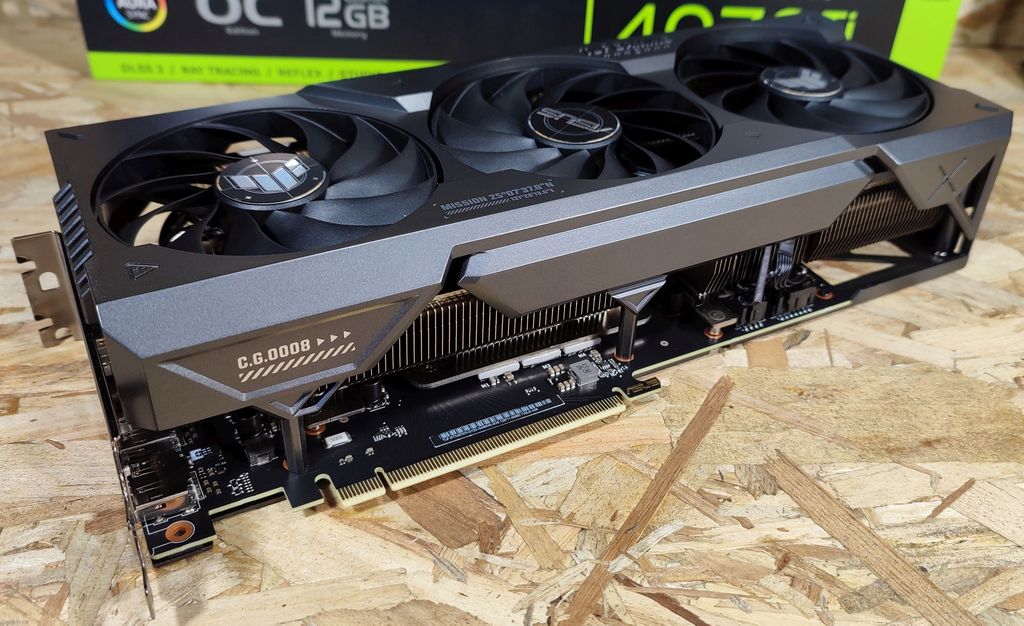
The VGA cooler has three 9-cm fans. These fans are stopped in idle / light workload and spin when workload is higher:
The two side fans spin counterclockwise to minimize turbulence and maximize air dispersion through the heatsink. All three fans come to a standstill when GPU temps are below 50 Celsius, letting you play less-demanding games or perform light tasks in relative silence. Fans start up again when temps are over 55 Celsius, referencing a speed curve that balances performance and acoustics for work or play.
That’s why in GPU monitoring tools like GPU Shark or GPU-Z, there are only two fan sensors for this RTX 4070 Ti: one sensor is for the middle fan and the second one is for the two side fans.

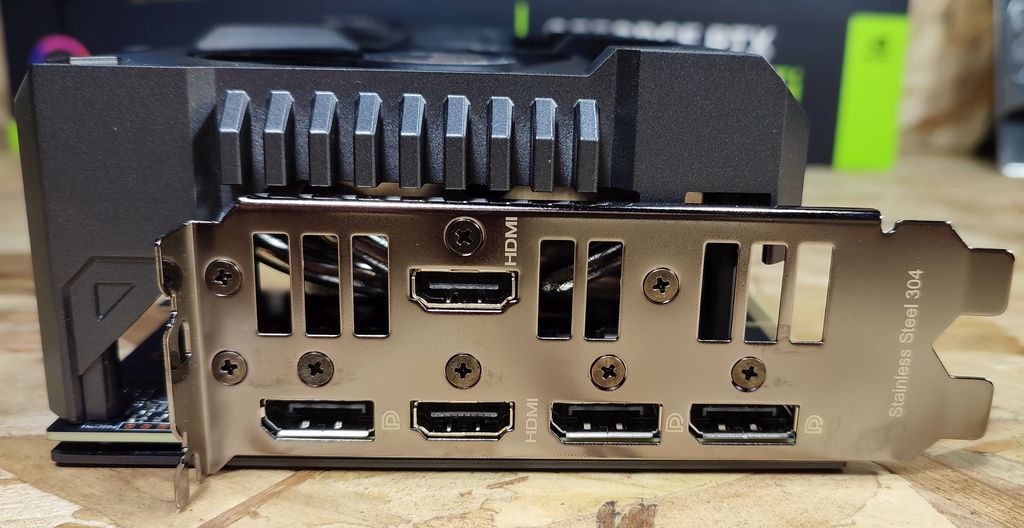
Output connectors: two HDMi 2.1a (up to 4k @ 240Hz or 8k @ 60Hz) and three DisplayPort 1.4a (up to 4k @ 240Hz or 8k @ 60Hz).
The aluminum backplate.
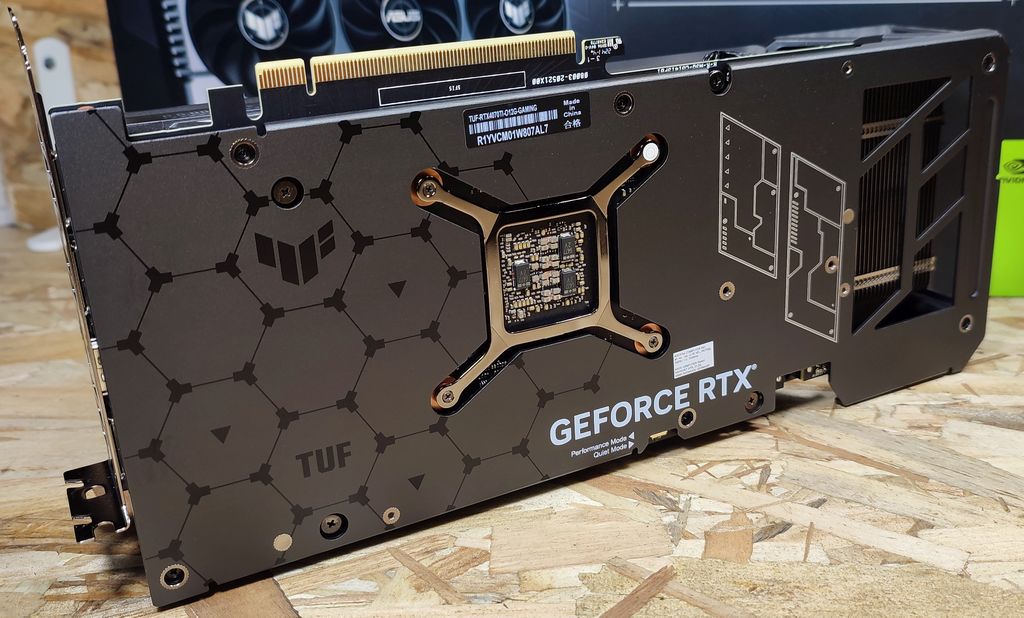
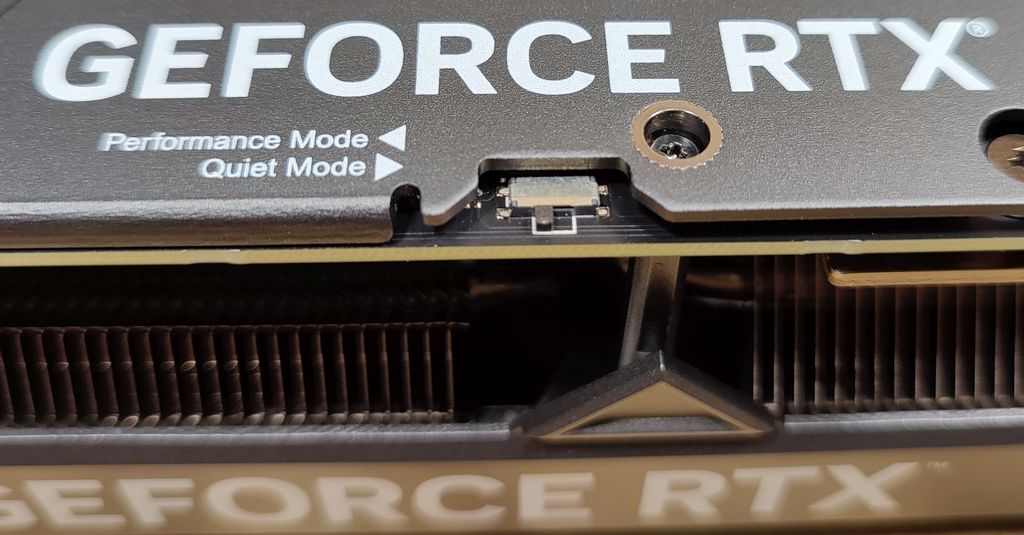
The dual-bios switch. Default position is on Performance mode.
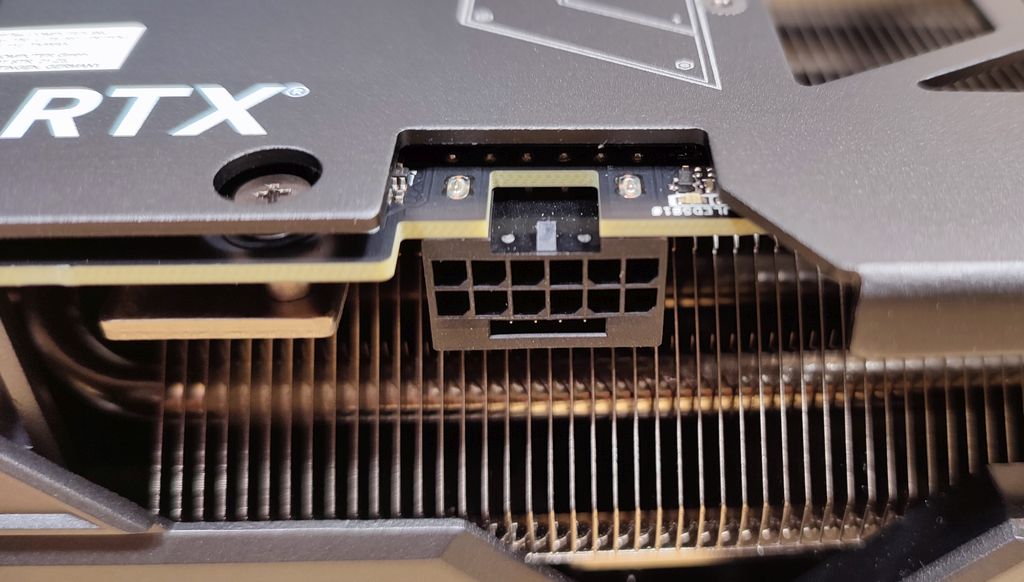
The 16-pin 12VHPWR power connector (300W).
The ARGB lighting (that can be controlled by AURA compatible software):

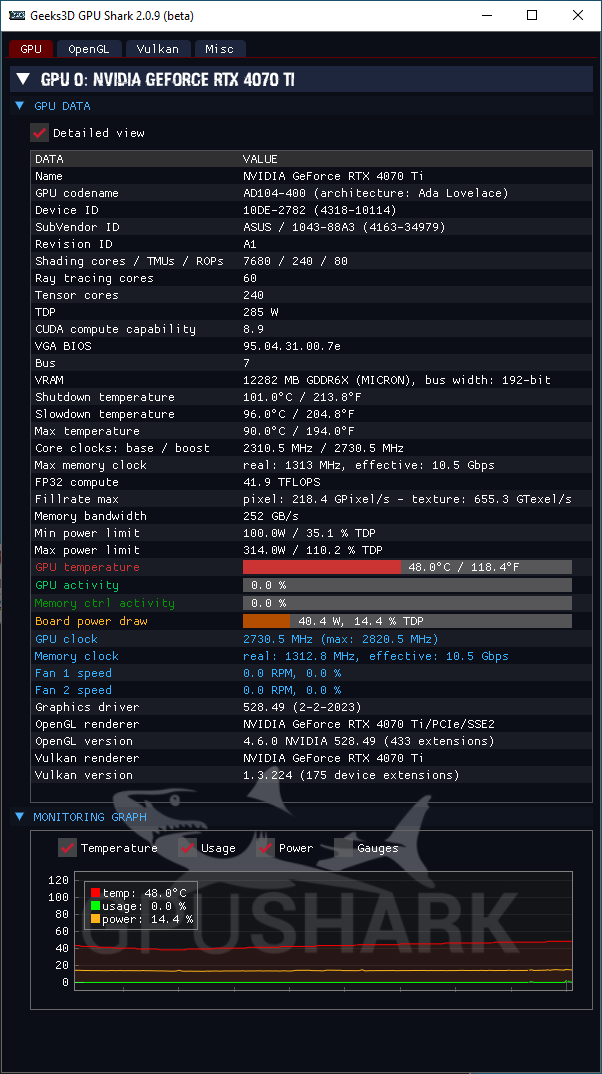
3 – GPU Information
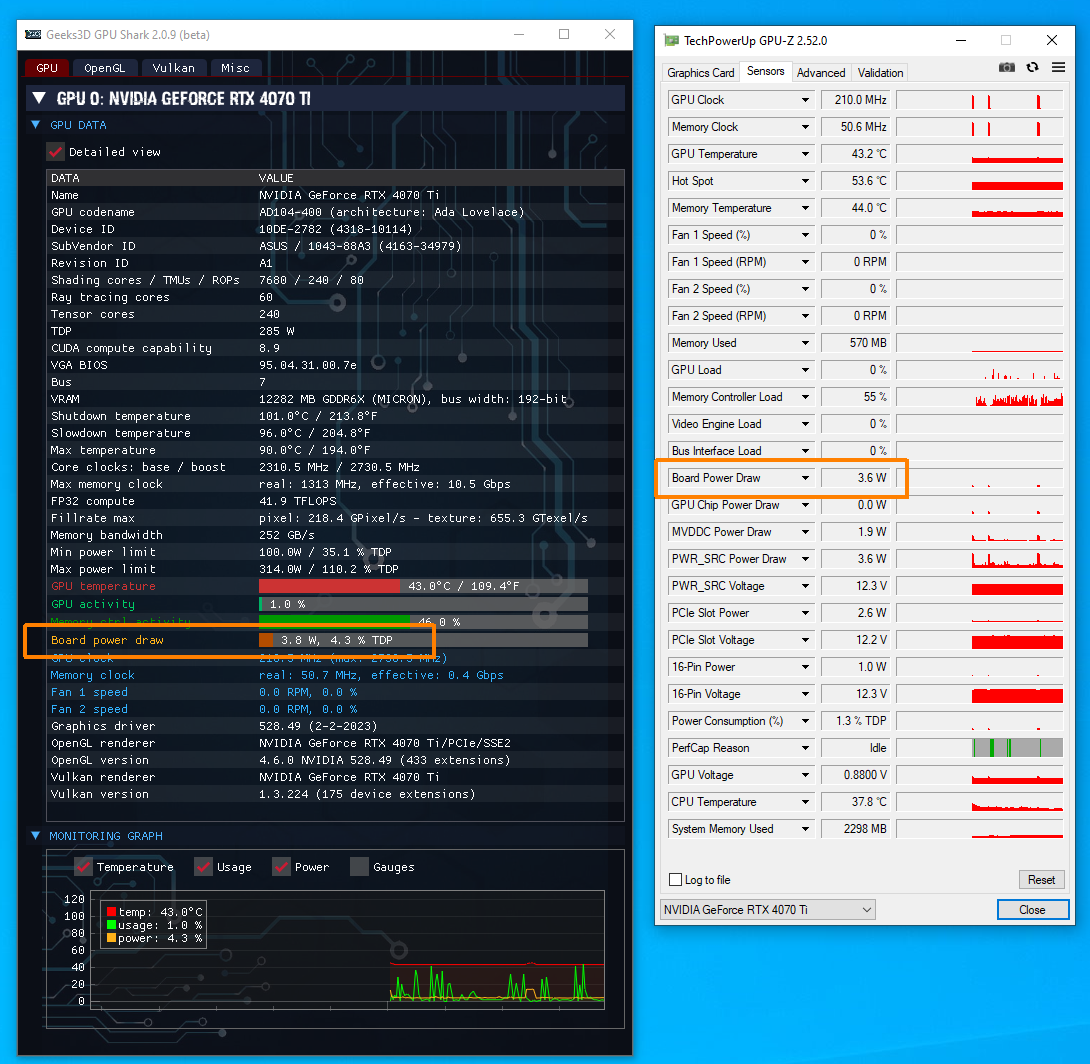
GPU data from the new GPU Shark 2:
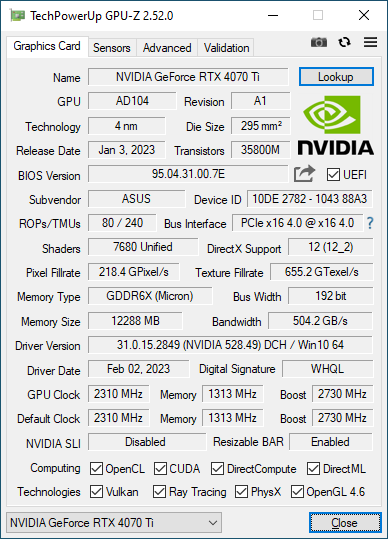
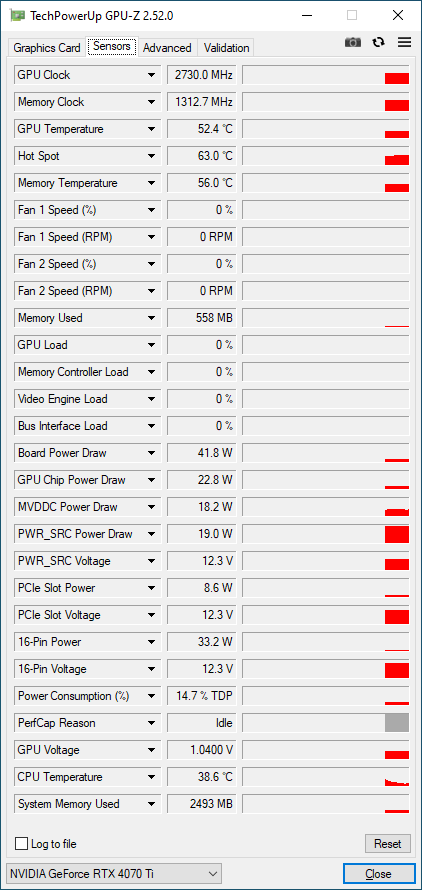
GPU-Z screenshots.
4 – GPU Benchmarks
| Arc A380 Test System 2 | |
|---|---|
| CPU | AMD Ryzen 7 5800X |
| Motherboard | ASUS TUF X570-Plus |
| Memory | 16GB DDR4 Corsair Vengeance LED @ 3200MHz |
| PSU | Corsair RM1000x |
| Storage | Samsung 860 EVO 1TB SSD |
| Monitor | ASUS TUF VG289Q 4K |
| OS | Windows 10 22H2 64-bit |
| Graphics driver | GeForce 528.49 |
4.1 – 3DMark FireStrike
Fire Strike is a DirectX 11 benchmark for high-performance gaming PCs and overclocked systems. Fire Strike is very demanding, even for the latest graphics cards. If your frame rate is low, use Sky Diver instead.
Graphics test 1 has heavy tessellation and volumetric illumination. Graphics test 2 features complex smoke simulation using compute shaders on the GPU and dynamic particle illumination.
The Physics test runs 32 parallel simulations of soft and rigid body physics on the CPU.
The Combined test includes tessellation, illumination, smoke simulation and particles and post-processing on the GPU, while the CPU is tasked with running 32 parallel physics simulations.
Firestrike has a global score and three sub-scores (graphics, physics and combined). For this test, I compare the graphics score only.
| 77375 SAPPHIRE Nitro+ Radeon RX 7900 XTX 24GB – Adrenalin 23.1.2 |
| 53903 ASUS TUF RTX 4070 Ti 12GB OC – GeForce 528.49 |
| 48432 ASUS TUF Radeon RX 6800 XT OC 16GB – Adrenalin 20.12.2 |
| 31431 Intel Arc A750 LE – Intel 31.0.101.3793 – Resizable BAR: ON |
| 29130 GIGABYTE GeForce RTX 3060 Ti Gaming OC 8G – GeForce 460.79 |
| 13079 EVGA GeForce GTX 1060 SC 6GB – GeForce 416.94 |
| 11368 MSI GeForce GTX 970 – GeForce 416.94 |
| 9402 ASRock Arc A380 – Intel 31.0.101.3491 |
| 8616 MSI Radeon HD 7970 – Adrenalin 18.11.1 |
4.2 – 3DMark TimeSpy
Time Spy is a DirectX 12 benchmark with native support for new API features like asynchronous compute, explicit multi-adapter, and multi-threading.
Time Spy Graphics tests are rendered at 2560 × 1440 resolution.Graphics test 1 features lots of transparent content, particle shadows, and tessellation. Graphics test 2 features ray-marched volumetric illumination
with hundreds of lights and a large number of small particles.
Same thing, I took the graphics score only.
| 29930 SAPPHIRE Nitro+ Radeon RX 7900 XTX 24GB – Adrenalin 23.1.2 |
| 22263 ASUS TUF RTX 4070 Ti 12GB OC – GeForce 528.49 |
| 16294 ASUS TUF Radeon RX 6800 XT OC 16GB – Adrenalin 20.12.2 |
| 12264 Intel Arc A750 LE – Intel 31.0.101.3793 – Resizable BAR: ON |
| 10837 GIGABYTE GeForce RTX 3060 Ti Gaming OC 8G – GeForce 460.79 |
| 10415 ASUS ROG Strix GeForce RTX 2080 OC 8GB – GeForce 460.89 |
| 8461 MSI GeForce RTX 2070 Ventus 8GB – GeForce 417.01 |
| 4776 SAPPHIRE Radeon RX 5500 XT Pulse – Adrenalin 20.01.3 |
| 4334 ASRock Arc A380 – Intel 31.0.101.3491 – Resizable BAR: OFF |
| 4301 ASRock Arc A380 – Intel 31.0.101.3491 – Resizable BAR: ON |
| 4244 EVGA GeForce GTX 1060 SC 6GB – GeForce 416.94 |
| 753 Intel UHD Graphics 770 – Intel 31.0.101.1371 |
4.3 – 3DMark Port Royal
Port Royal is a graphics card benchmark for testing real-time ray tracing performance. To run this test, you must have a graphics card and drivers that support Microsoft DirectX Raytracing.
The test measures graphics card performance with a combination of real-time ray tracing and traditional rendering techniques. The scene features ray traced reflections, shadows (ray traced and shadow mapped), glass surfaces with ray traced reflections, volumetric lighting, particles, and post-processing effects. The rendering resolution is 2560 × 1440.
| 15816 SAPPHIRE Nitro+ Radeon RX 7900 XTX 24GB – Adrenalin 23.1.2 |
| 13859 ASUS TUF RTX 4070 Ti 12GB OC – GeForce 528.49 |
| 9149 ASUS TUF Radeon RX 6800 XT OC 16GB – Adrenalin 20.12.2 |
| 6916 GIGABYTE GeForce RTX 3060 Ti Gaming OC 8G – GeForce 460.79 |
| 6512 Intel Arc A750 LE – Intel 31.0.101.3793 – Resizable BAR: ON |
| 6863 ASUS ROG Strix GeForce RTX 2080 OC 8GB – GeForce 460.89 |
| 745 ASRock Arc A380 – Intel 31.0.101.3491 – Resizable BAR: ON |
| 666 ASRock Arc A380 – Intel 31.0.101.3491 – Resizable BAR: OFF |
4.4 – 3DMark DX Raytracing Test
The DirectX Raytracing feature test measures pure ray-tracing performance. Use this test to compare the performance of dedicated ray-tracing hardware in the latest graphics cards.
In this feature test, there is a minimal amount of traditional rendering. The result of the test depends entirely on the ray-tracing performance of the graphics card.
Instead of using traditional rendering, the whole scene is ray-traced and drawn in one pass. Camera rays are traced across the field of view with small random offsets to simulate a depth of field effect. The frame rate is determined by the time taken to trace and shade a set number of samples for each
pixel (12 samples per pixel), combine the results with previous samples and present the output on the screen. The rendering resolution is 2560 × 1440.

| 66.85 ASUS TUF RTX 4070 Ti 12GB OC – GeForce 528.49 |
| 51.86 SAPPHIRE Nitro+ Radeon RX 7900 XTX 24GB – Adrenalin 23.1.2 |
| 28.78 FPS Intel Arc A750 LE – Intel 31.0.101.3793 – Resizable BAR: ON |
| 27.43 GIGABYTE GeForce RTX 3060 Ti Gaming OC 8G – GeForce 522.25 |
| 25.25 FPS ASUS TUF Radeon RX 6800 XT OC 16GB – Adrenalin 22.10.1 |
| 21.5 FPS ASUS ROG Strix GeForce RTX 2080 OC 8GB – GeForce 522.25 |
| 9 FPS ASRock Arc A380 – Intel 31.0.101.3491 |
4.5 – 3DMark Speed Way
3DMark Speed Way is a graphics card benchmark for testing DirectX 12 Ultimate performance. To run this test, you must have a graphics card that supports DirectX 12 Ultimate and has 6GB or more of video memory.
Graphics test: the test measures graphics card performance with a combination of real-time ray tracing and traditional rendering techniques. The scene features ray traced reflections, real time global illumination, mesh shaders, volumetric lighting, particles and post-processing effects. The rendering resolution is 2560 × 1440.
| 6294 SAPPHIRE Nitro+ Radeon RX 7900 XTX 24GB – Adrenalin 23.1.2 |
| 5374 ASUS TUF RTX 4070 Ti 12GB OC – GeForce 528.49 |
| 3433 (avg FPS: 34) ASUS TUF Radeon RX 6800 XT OC 16GB – Adrenalin 22.10.1 |
| 2970 (avg FPS: 29) GIGABYTE GeForce RTX 3060 Ti Gaming OC 8G – GeForce 522.25 |
| 2320 (23.2 FPS) Intel Arc A750 LE – Intel 31.0.101.3793 – Resizable BAR: ON |
| 2168 (avg FPS: 21) ASUS ROG Strix GeForce RTX 2080 OC 8GB – GeForce 522.25 |
| 434 (avg FPS: 4) ASRock Arc A380 6GB – Resizable BAR: ON – Intel 31.0.101.3491 |
| 375 (avg FPS: 3) ASRock Arc A380 6GB – Resizable BAR: OFF – Intel 31.0.101.3491 |
4.6 – Unigine Superposition – 1080p Medium – Direct3D
| 38879 (avg FPS: 290) SAPPHIRE Nitro+ Radeon RX 7900 XTX 24GB – Adrenalin 23.1.2 |
| 37445 (avg FPS: 280) ASUS TUF RTX 4070 Ti 12GB OC – GeForce 528.49 |
| 21154 (avg FPS: 175) GIGABYTE GeForce RTX 3060 Ti Gaming OC 8G – GeForce 460.79 |
| 20985 (avg FPS: 157) ASUS TUF Radeon RX 6800 XT OC 16GB – Adrenalin 20.12.2 |
| 20923 (156 FPS) Intel Arc A750 LE – Intel 31.0.101.3793 – Resizable BAR: ON |
| 9082 (avg FPS: 67.9) EVGA GeForce GTX 1060 SC 6GB – GeForce 416.94 |
| 7166 (avg FPS: 53) ASRock Arc A380 – Intel 31.0.101.3491 – Resizable BAR: ON |
| 6141 (avg FPS: 46) ASRock Arc A380 – Intel 31.0.101.3491 – Resizable BAR: OFF |
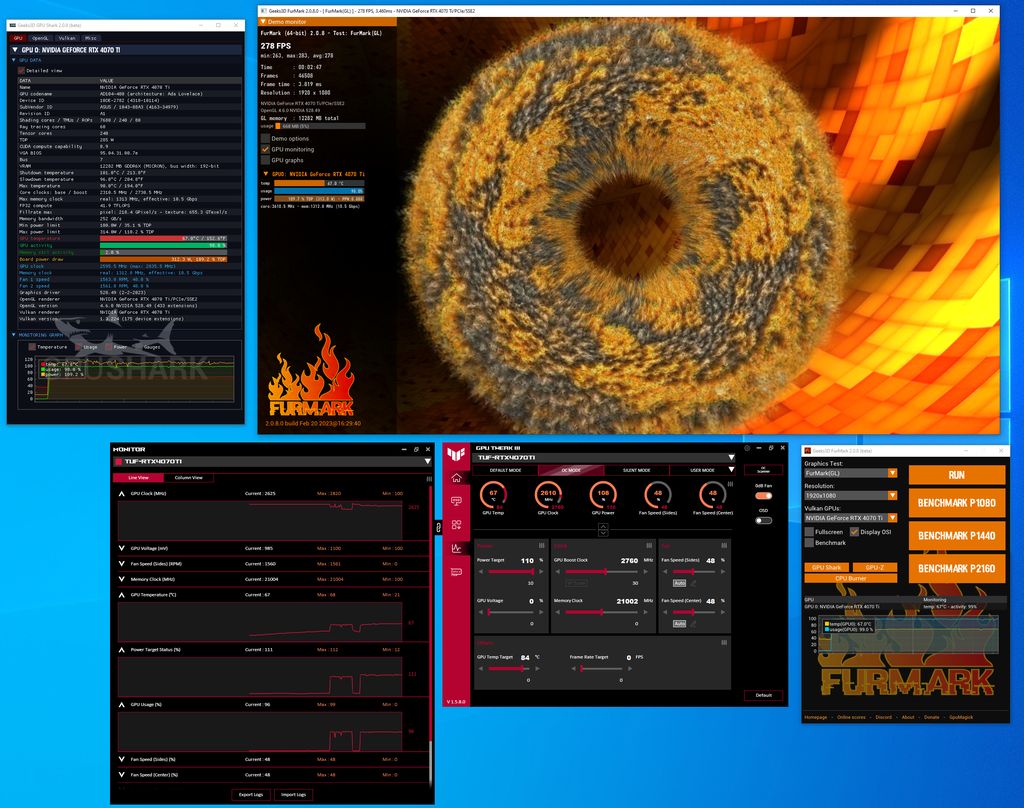
4.7 – FurMark 1.33
FurMark is a very intensive graphics benchmark and does not depend on the processing power of the CPU. So FurMark is a quick way to have an overview of the graphics performances of a GPU.
P1080 (1920×1080)
| 27719 (453 FPS) SAPPHIRE Nitro+ Radeon RX 7900 XTX 24GB – Adrenalin 23.1.2 |
| 24052 (401 FPS) ASUS TUF RTX 4070 Ti 12GB OC – GeForce 528.49 |
| 17507 (avg FPS: 292) ASUS TUF Radeon RX 6800 XT OC 16GB – Adrenalin 20.12.2 |
| 10530 (avg FPS: 175) GIGABYTE GeForce RTX 3060 Ti Gaming OC 8G – GeForce 460.79 |
| 10137 (169 FPS) Intel Arc A750 LE – Intel 31.0.101.3793 – Resizable BAR: ON |
| 7322 (avg FPS: 122) ASUS ROG Strix GeForce GTX 1080 OC 8GB – GeForce 416.94 |
| 4556 (avg FPS: 76) EVGA GeForce GTX 1060 SC 6GB – GeForce 416.94 |
| 4475 (avg FPS: 75) SAPPHIRE Radeon RX 5500 XT Pulse – Adrenalin 20.01.3 |
| 3246 (avg FPS: 54) MSI Radeon HD 7970 – Adrenalin 18.11.1 |
| 3036 (avg FPS: 50) ASRock Arc A380 – Intel 31.0.101.3491 – Resizable BAR: ON |
| 2969 (avg FPS: 49) ASRock Arc A380 – Intel 31.0.101.3491 – Resizable BAR: OFF |
| 714 (avg FPS: 12) Intel UHD Graphics 770 – Intel 31.0.101.1371 |
4.8 – Rhodium LC
Rhodium LC (LC for Liquid Carbon!) is a new GPU pixel shader benchmark made with GeeXLab and based on this shadertoy demo. You can download RhodiumLC from THIS PAGE.
P1080 (1920×1080)
| 17026 (283 FPS) SAPPHIRE Nitro+ Radeon RX 7900 XTX 24GB – Adrenalin 23.1.2 |
| 8721 (145 FPS) ASUS TUF RTX 4070 Ti 12GB OC – GeForce 528.49 |
| 6189 (103 FPS) Intel Arc A750 LE – Intel 31.0.101.3793 – Resizable BAR: ON |
| 5740 (avg FPS: 95) ASUS TUF Radeon RX 6800 XT OC 16GB – Adrenalin 20.12.2 |
| 4853 (avg FPS: 80) ASUS ROG Strix GeForce RTX 2080 OC 8GB – GeForce 416.94 |
| 4094 (avg FPS: 68) GIGABYTE GeForce RTX 3060 Ti Gaming OC 8G – GeForce 526.98 |
| 2835 (avg FPS: 47) EVGA GeForce GTX 1070 FTW – GeForce 416.94 |
| 2773 (avg FPS: 46) ASUS Strix Radeon RX 5700 – Adrenalin 20.12.2 |
| 1923 (avg FPS: 32) EVGA GeForce GTX 1060 SC 6GB – GeForce 416.94 |
| 1755 (avg FPS: 29) SAPPHIRE Radeon RX 5500 XT Pulse – Adrenalin 20.01.3 |
| 1719 (avg FPS: 28) ASRock Arc A380 – Intel 31.0.101.3491 |
| 1484 (avg FPS: 24) MSI GeForce GTX 970 – GeForce 416.94 |
| 1192 (avg FPS: 19) MSI Radeon RX 470 8GB – Adrenalin 18.11.1 |
| 303 (avg FPS: 5) Intel UHD Graphics 770 – Intel 31.0.101.1371 |
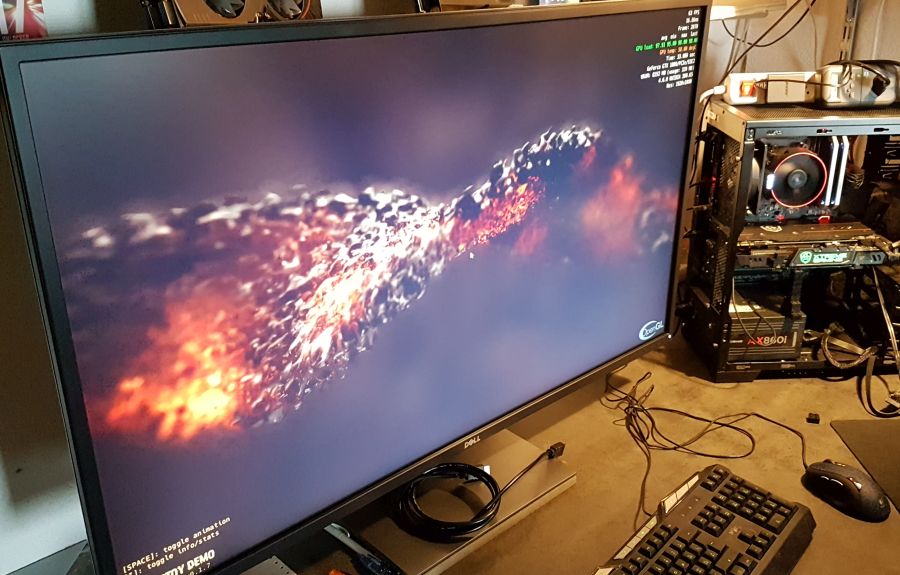
5 – Burn-in Test
The burn-in test has been done with the new version of FurMark 2 (beta version available on discord). This version of FurMark is 64-bit and uses OpenGL or Vulkan API. I used the OpenGL version for the stress test. I did two stress tests: the first one with the power limit target set to 100% (default mode in ASUS GPU Tweak III) and the second one set to +110% (OC mode in GPU Tweak).
During both stress tests, the BIOS switch was on the position 1 (max performance).
Idle state
– total power consumption of the testbed: 110W
– GPU temperature: 45°C
– total graphics card: 39W
Stress test 1 – Default mode – Power limit set to 100%, GPU clock: 2730 MHz
– total power consumption of the testbed: 415W
– GPU temperature: 65°C
– total graphics card: 284W (GPU clock: 2505 MHz)
Stress test 2 – OC mode – Power limit set to 110%, GPU clock: 2760 MHz
– total power consumption of the testbed: 446W
– GPU temperature: 67°C
– total graphics card: 312W (GPU clock: 2610 MHz)
Under heavy stress test, the fans are audible. The noise is very reasonable though (open case, bench table). But, and this is the important thing, the cooler does its job by keeping the GPU temperature under control: 67°C was the max reached. And I had no thermal / electrical issue with the 16-pin power connector.
6 – Conclusion
Here are pros and cons of this graphics card:
PROS:
- industrial look, AURA lighting
- ASUS GPU Tweak
- ray tracing performance (faster than RX 7900 XTX)
- factory overclocked (+6%)
- gadgets: mobile phone holder, graphics card holder
- passive mode in idle and light graphics workload
- two HDMI 2.1 and three DP 1.4a ports
- efficient VGA cooler
- very low power consumption at idle: 3W
CONS:
power consumption at idle: 40W. I’m sorry but today, electricity is expensive and its production has a massive impact on our environment, so 40W just to display the Windows desktop is a bit too much (for comparison, the Radeon 7900 XTX pulls 10W at idle).- fans are a bit audible under heavy load
For graphics developers, the RTX 40 supports the same features than previous gen RTX 30. The RTX 4070 Ti has the same number of OpenGL extensions and the same number of Vulkan device extensions than a RTX 3060 Ti. This is the state today but it may change in the future, especially in Vulkan.
UPDATE (2023.02.22)
After some investigations, I found why the power consumption at idle was 40W: the power management in NVIDIA 3D Settings was set to “Prefer maximum performance” (I don’t know why this option was selected). Then the GPU core clock speed was always at 2730MHz which led to the 40W at idle. Now I set the option to “Normal” and the power consumption dropped to… 3W! Just perfect.
https://tpucdn.com/review/zotac-rtx-4070-ti-amp-extreme-airo/images/power-idle.png
https://tpucdn.com/review/asus-geforce-rtx-4070-ti-tuf/images/power-idle.png
Something on your test system is causing the high power consumption at idle. It shouldn’t be 40W.
Thanks for the info, I will check the idle power draw again.
The GPU core clock is locked at 2730 MHz even in idle (GPU usage = 0), I think that’s the cause of the abnormal power draw at idle. Now the question: why the core clock speed stays at 2730MHz?
I found the bug and updated the conclusion. Thanks again for your feedback!
Now: 3W, better than TPU 😉
Hi there, what would you go to for streaming while gaming in 1440p? Between 4070Ti and 7900 XTX… can’t decide thanks