Article index
- 1 – Overview
- 2 – Gallery
- 3 – GPU information
- 4 – Benchmarks
- 4.1 – 3DMark FireStrike
- 4.2 – 3DMark TimeSpy
- 4.3 – 3DMark Port Royal
- 4.4 – 3DMark DX Raytracing Test
- 4.5 – 3DMark Intel XeSS Test
- 4.6 – Unigine Superposition
- 4.7 – FurMark
- 4.8 – Rhodium LC
- 5 – Burn-in Test
- 6 – Conclusion
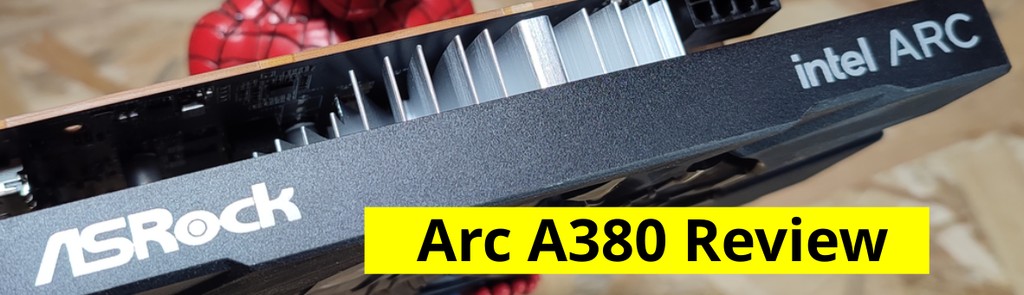
1 – Overview
After years and years of news, leaks, name changes and abandons, Intel has finally managed to materialize a family of discrete graphics cards for our PCs. For this review, I tested the first member, the Arc A380, that has been launched in June 2022. But finding today an Arc GPU is still difficult, 5 months later. Even the recent A770 / A750 are ghost graphics cards in retailers! Actually, it’s not limited to Arc GPUs, any new graphics card (like the RTX 4090) is just impossible to find.
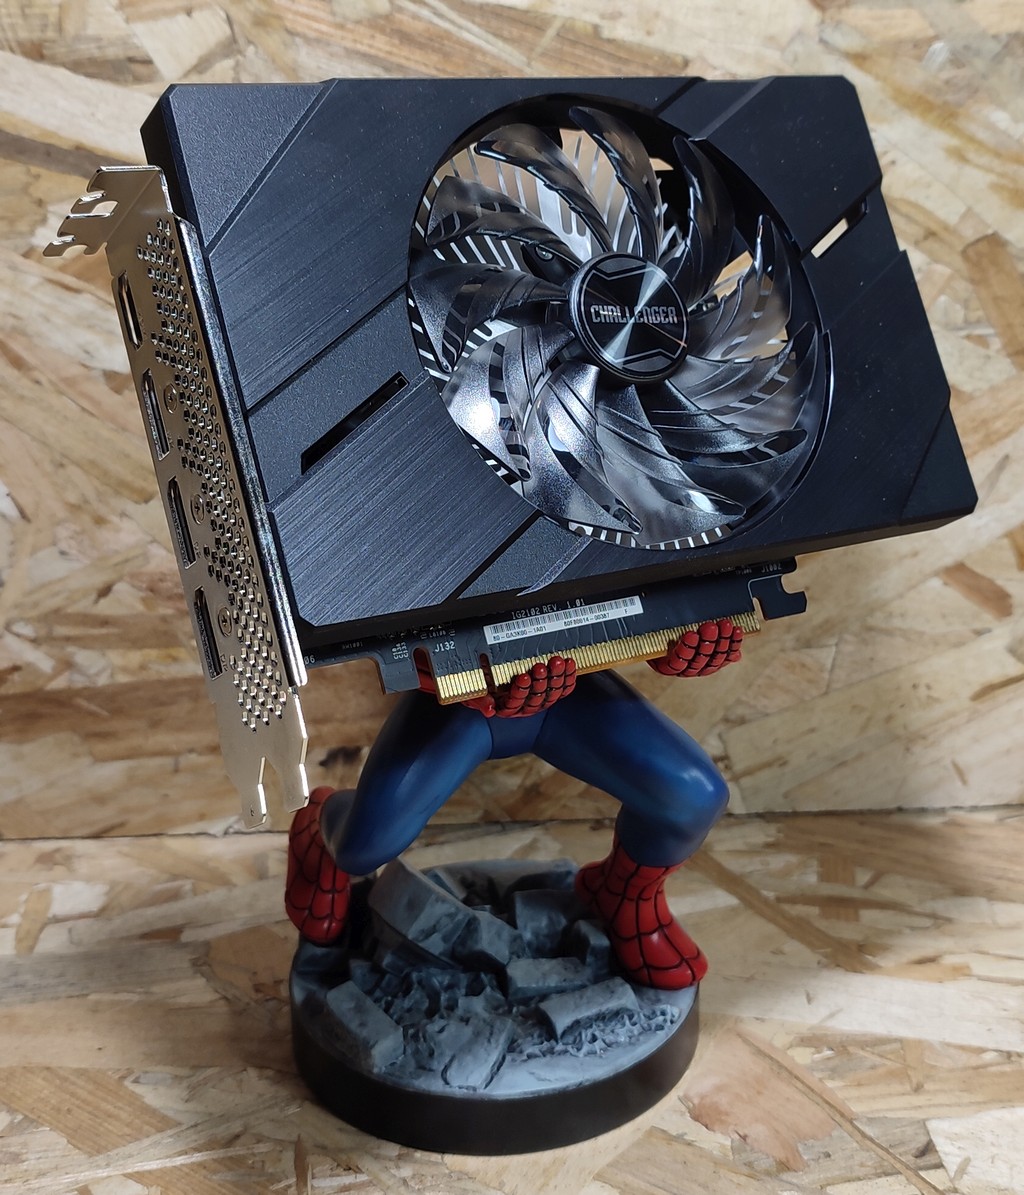
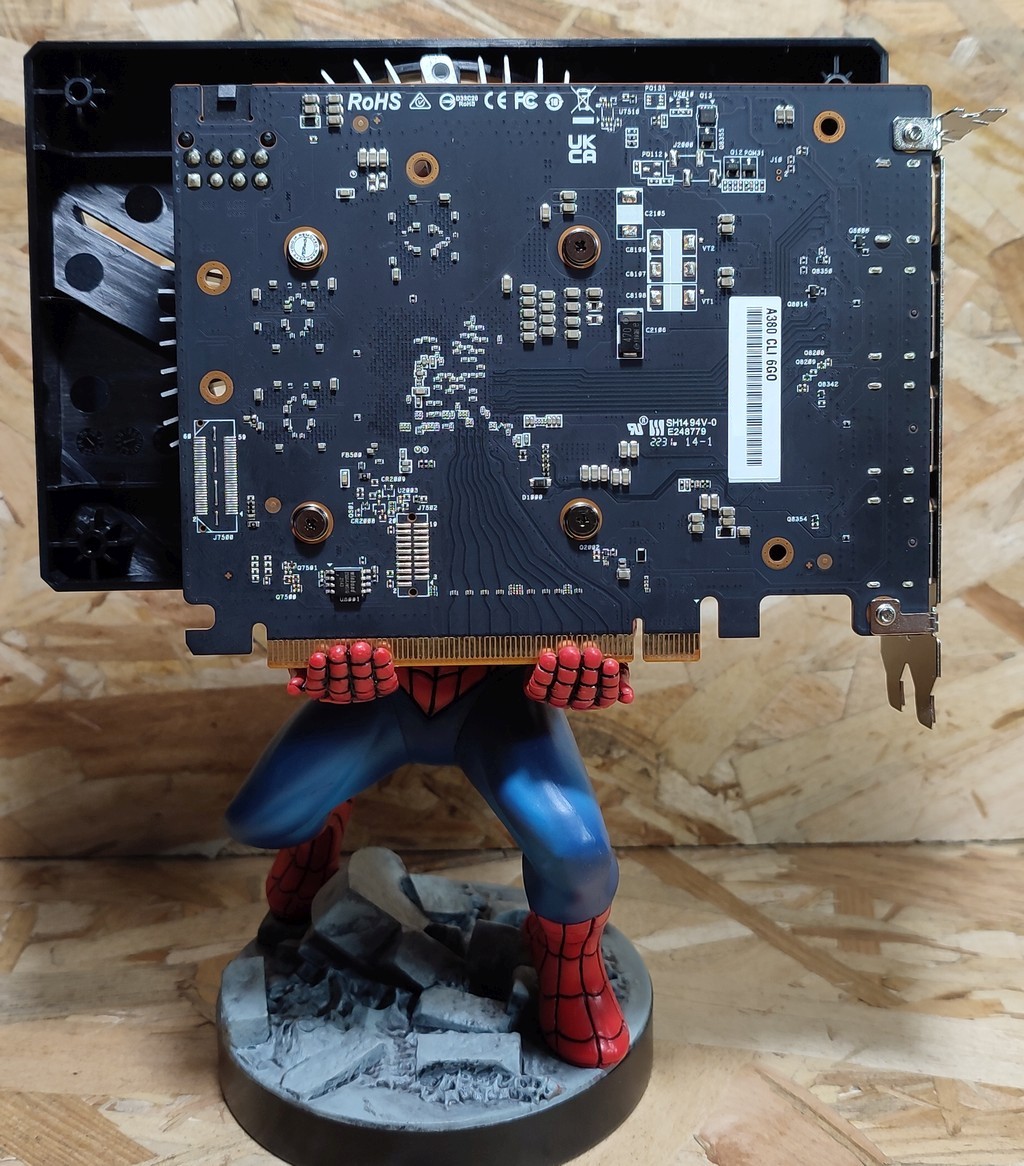
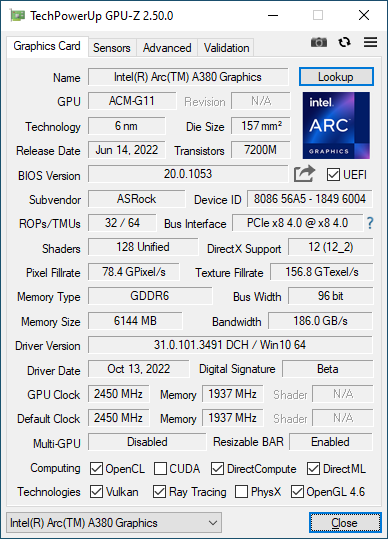
The ASRock Arc A380 Challenger ITX is a graphics card based on the DG2-128 GPU (Xe HPG micro-architecture). The A380 is factory overclocked: the GPU is clocked at 2250 MHz, which is +250 MHz compared to the reference clock speed. But GPU-Z and Intel telemetry utility give me 2450 MHz (+450MHz).
The A380 has 8 Xe-cores that can be translated to 128 EUs (16 Execution Units / Xe-core) or to 1024 shader cores (128 shader cores / Xe-core) if we want to compare with GeForce or Radeon GPUs. ASRock A380 has 6GB of GDDR6 graphics memory on a 96-bit memory bus. The memory is not overclocked: 15.5 Gbps like on Intel reference board.
ASRock Arc A380 has a 0-dB VGA cooler: the cooler is in passive mode (fan speed: 0) for light workloads. For heavy graphics tasks, the fan spins but remains quiet!
More marketing blabla is available on the homepage: Intel Arc A380 Challenger ITX 6GB OC.
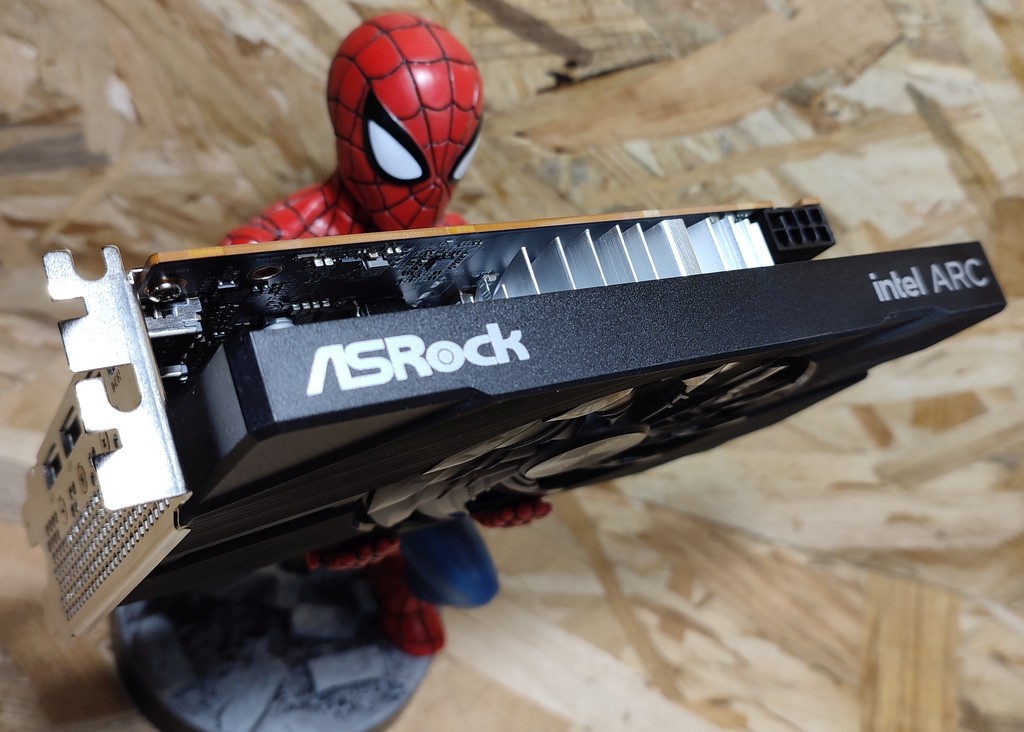
2 – Gallery
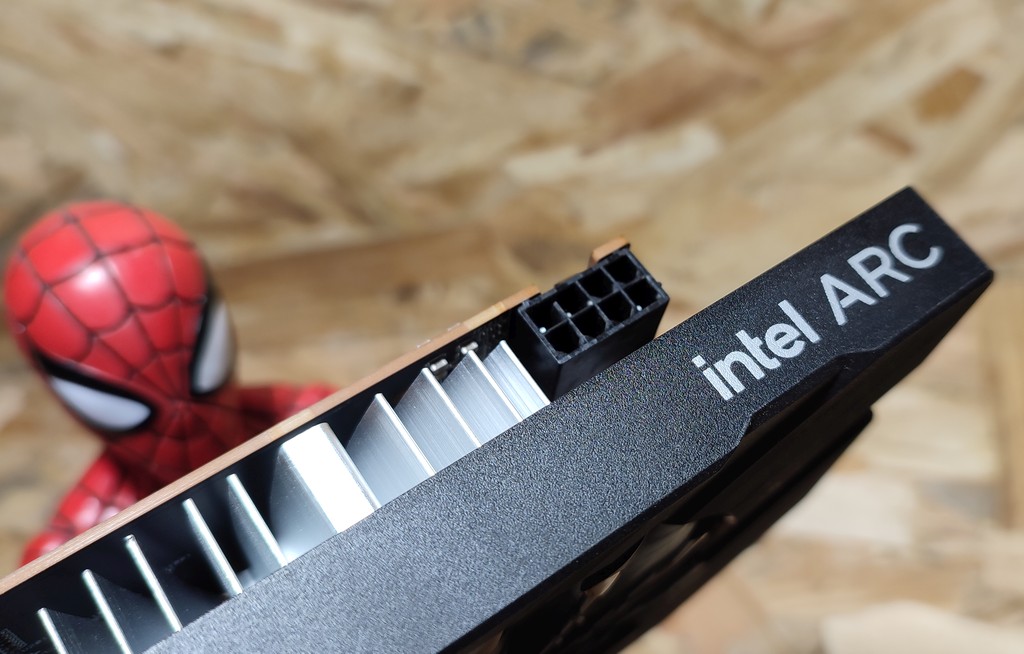
The bundle: the Arc A380 graphics card, a quick installation guide and the box. What else? Niente!

The A380 has a TBP (total board power) of 75W. In theory, no power connector is required, the PCI-Express bus can deliver those 75 Watts. For security reasons, a 6-pin connector would have been enough (75+75 = 150W). So why a 8-pin connector (75 + 150 = 225W) ?
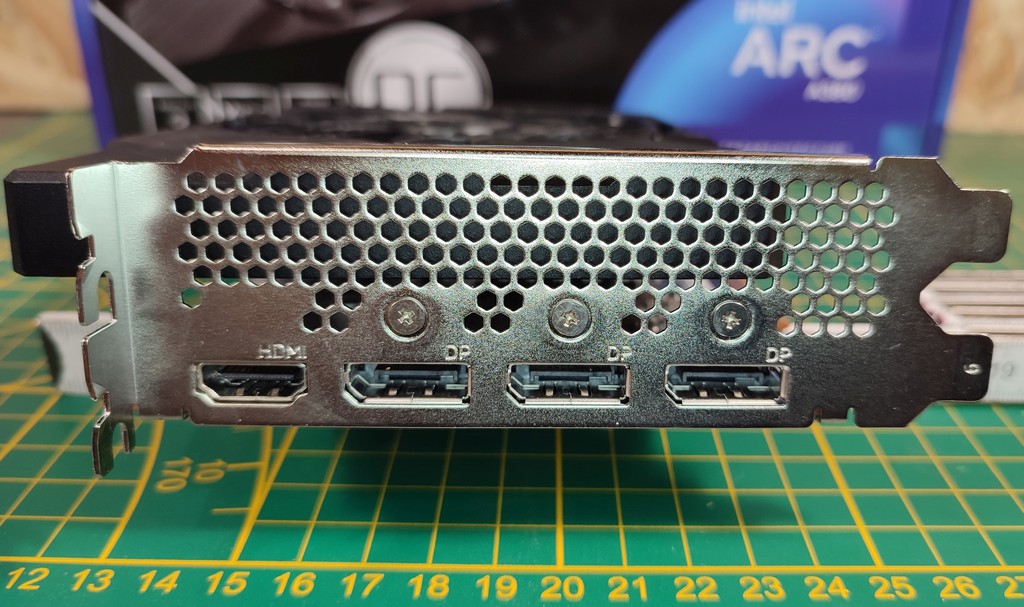
The A380 has one HDMI 2.0b (4K @ 60Hz + HDR10) output and three DisplayPort 2.0 (16K @ 60Hz, 8K @ 120Hz…) connectors:
3 – GPU Information
The usual GPU-Z screenshots.
4 – GPU Benchmarks
| Arc A380 Test System 2 | |
|---|---|
| CPU | AMD Ryzen 7 5800X |
| Motherboard | ASUS TUF X570-Plus |
| Memory | 16GB DDR4 Corsair Vengeance LED @ 3200MHz |
| PSU | Corsair RM1000x |
| Storage | Samsung 860 EVO 1TB SSD |
| OS | Windows 10 22H2 64-bit |
| Graphics driver | Intel v31.0.101.3491 |
4.1 – 3DMark FireStrike
Fire Strike is a DirectX 11 benchmark for high-performance gaming PCs and overclocked systems. Fire Strike is very demanding, even for the latest graphics cards. If your frame rate is low, use Sky Diver instead.
Graphics test 1 has heavy tessellation and volumetric illumination. Graphics test 2 features complex smoke simulation using compute shaders on the GPU and dynamic particle illumination.
The Physics test runs 32 parallel simulations of soft and rigid body physics on the CPU.
The Combined test includes tessellation, illumination, smoke simulation and particles and post-processing on the GPU, while the CPU is tasked with running 32 parallel physics simulations.
Firestrike has a global score and three sub-scores (graphics, physics and combined). For this test, I compare the graphics score only.
| 48432 ASUS TUF Radeon RX 6800 XT OC 16GB – Adrenalin 20.12.2 |
| 29130 GIGABYTE GeForce RTX 3060 Ti Gaming OC 8G – GeForce 460.79 |
| 13079 EVGA GeForce GTX 1060 SC 6GB – GeForce 416.94 |
| 11368 MSI GeForce GTX 970 – GeForce 416.94 |
| 9402 ASRock Arc A380 – Intel 31.0.101.3491 |
| 8616 MSI Radeon HD 7970 – Adrenalin 18.11.1 |
4.2 – 3DMark TimeSpy
Time Spy is a DirectX 12 benchmark with native support for new API features like asynchronous compute, explicit multi-adapter, and multi-threading.
Time Spy Graphics tests are rendered at 2560 × 1440 resolution.Graphics test 1 features lots of transparent content, particle shadows, and tessellation. Graphics test 2 features ray-marched volumetric illumination
with hundreds of lights and a large number of small particles.
Same thing, I took the graphics score only.
| 16294 ASUS TUF Radeon RX 6800 XT OC 16GB – Adrenalin 20.12.2 |
| 10837 GIGABYTE GeForce RTX 3060 Ti Gaming OC 8G – GeForce 460.79 |
| 10415 ASUS ROG Strix GeForce RTX 2080 OC 8GB – GeForce 460.89 |
| 8461 MSI GeForce RTX 2070 Ventus 8GB – GeForce 417.01 |
| 4776 SAPPHIRE Radeon RX 5500 XT Pulse – Adrenalin 20.01.3 |
| 4334 ASRock Arc A380 – Intel 31.0.101.3491 – Resizable BAR: OFF |
| 4301 ASRock Arc A380 – Intel 31.0.101.3491 – Resizable BAR: ON |
| 4244 EVGA GeForce GTX 1060 SC 6GB – GeForce 416.94 |
| 753 Intel UHD Graphics 770 – Intel 31.0.101.1371 |
4.3 – 3DMark Port Royal
Port Royal is a graphics card benchmark for testing real-time ray tracing performance. To run this test, you must have a graphics card and drivers that support Microsoft DirectX Raytracing.
The test measures graphics card performance with a combination of real-time ray tracing and traditional rendering techniques. The scene features ray traced reflections, shadows (ray traced and shadow mapped), glass surfaces with ray traced reflections, volumetric lighting, particles, and post-processing effects. The rendering resolution is 2560 × 1440.
Even if the Arc A380 is an entry level card, it has hardware raytracing units and then can run 3DMark Port Royal!
| 9149 ASUS TUF Radeon RX 6800 XT OC 16GB – Adrenalin 20.12.2 |
| 6916 GIGABYTE GeForce RTX 3060 Ti Gaming OC 8G – GeForce 460.79 |
| 6863 ASUS ROG Strix GeForce RTX 2080 OC 8GB – GeForce 460.89 |
| 745 ASRock Arc A380 – Intel 31.0.101.3491 – Resizable BAR: ON |
| 666 ASRock Arc A380 – Intel 31.0.101.3491 – Resizable BAR: OFF |
4.4 – 3DMark DX Raytracing Test
The DirectX Raytracing feature test measures pure ray-tracing performance. Use this test to compare the performance of dedicated ray-tracing hardware in the latest graphics cards.
In this feature test, there is a minimal amount of traditional rendering. The result of the test depends entirely on the ray-tracing performance of the graphics card.
Instead of using traditional rendering, the whole scene is ray-traced and drawn in one pass. Camera rays are traced across the field of view with small random offsets to simulate a depth of field effect. The frame rate is determined by the time taken to trace and shade a set number of samples for each
pixel (12 samples per pixel), combine the results with previous samples and present the output on the screen. The rendering resolution is 2560 × 1440.

| 27.43 GIGABYTE GeForce RTX 3060 Ti Gaming OC 8G – GeForce 522.25 |
| 25.25 FPS ASUS TUF Radeon RX 6800 XT OC 16GB – Adrenalin 22.10.1 |
| 21.5 FPS ASUS ROG Strix GeForce RTX 2080 OC 8GB – GeForce 522.25 |
| 9 FPS ASRock Arc A380 – Intel 31.0.101.3491 |
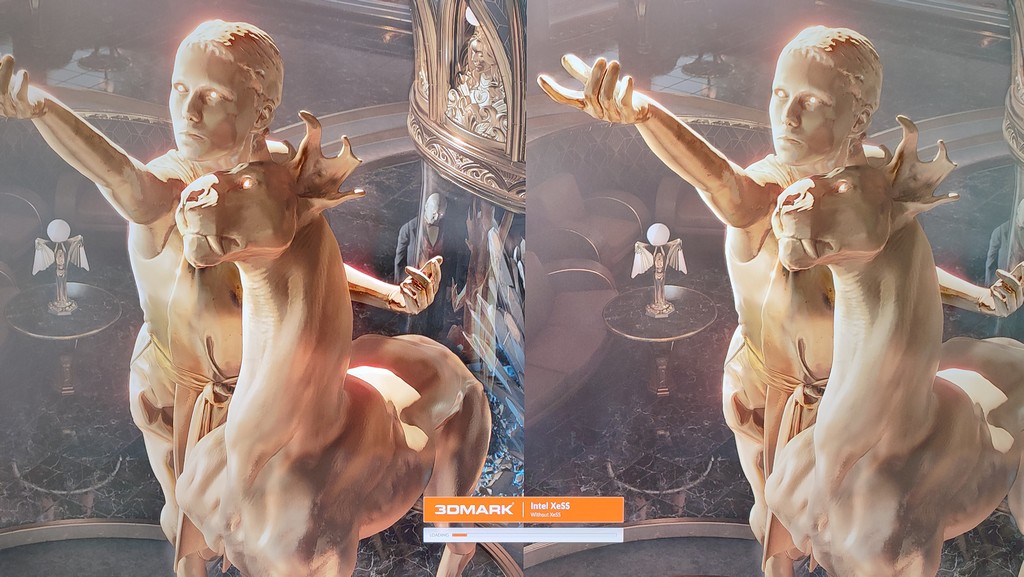
4.5 – 3DMark Intel XeSS Test
XeSS (Xe Super Sampling) is an Intel graphics technology that uses AI-enhanced upscaling to improve performance while maintaining high image fidelity. XeSS renders each frame at a lower resolution to boost performance and then uses AI upscaling to generate frames at the target output resolution.
The test renders a scene two times to show the effect XeSS has on performance and image quality. The first run measures baseline performance by rendering the scene with temporal anti-aliasing (TAA) at the output resolution. The second run renders the scene at a lower resolution then uses the selected XeSS mode to upscale the frames to the output resolution.
| OFF: 39.6 FPS, ON: 52.4 FPS ASUS TUF Radeon RX 6800 XT OC 16GB – Adrenalin 22.10.1 |
| OFF: 30.1 FPS, ON: 41.2 FPS GIGABYTE GeForce RTX 3060 Ti Gaming OC 8G – GeForce 522.25 |
| OFF: 2.2 FPS, ON: 12.7 FPS (+472%) ASRock Arc A380 – Intel 31.0.101.3491 – Resizable BAR: ON |
| OFF: 3.0 FPS, ON: 4.8 FPS (+62%) ASRock Arc A380 – Intel 31.0.101.3491 – Resizable BAR: OFF |
Whow! the resizable BAR has a huge effect on the XeSS score: +472%!
4.6 – Unigine Superposition – 1080p Medium – Direct3D
| 21154 (avg FPS: 175) GIGABYTE GeForce RTX 3060 Ti Gaming OC 8G – GeForce 460.79 |
| 20985 (avg FPS: 157) ASUS TUF Radeon RX 6800 XT OC 16GB – Adrenalin 20.12.2 |
| 9082 (avg FPS: 67.9) EVGA GeForce GTX 1060 SC 6GB – GeForce 416.94 |
| 7166 (avg FPS: 53) ASRock Arc A380 – Intel 31.0.101.3491 – Resizable BAR: ON |
| 6141 (avg FPS: 46) ASRock Arc A380 – Intel 31.0.101.3491 – Resizable BAR: OFF |
4.7 – FurMark 1.31
FurMark is a very intensive graphics benchmark and does not depend on the processing power of the CPU. So FurMark is a quick way to have an overview of the graphics performances of a GPU.
P1080 (1920×1080)
| 17507 (avg FPS: 292) ASUS TUF Radeon RX 6800 XT OC 16GB – Adrenalin 20.12.2 |
| 10530 (avg FPS: 175) GIGABYTE GeForce RTX 3060 Ti Gaming OC 8G – GeForce 460.79 |
| 7322 (avg FPS: 122) ASUS ROG Strix GeForce GTX 1080 OC 8GB – GeForce 416.94 |
| 4556 (avg FPS: 76) EVGA GeForce GTX 1060 SC 6GB – GeForce 416.94 |
| 4475 (avg FPS: 75) SAPPHIRE Radeon RX 5500 XT Pulse – Adrenalin 20.01.3 |
| 3246 (avg FPS: 54) MSI Radeon HD 7970 – Adrenalin 18.11.1 |
| 3036 (avg FPS: 50) ASRock Arc A380 – Intel 31.0.101.3491 – Resizable BAR: ON |
| 2969 (avg FPS: 49) ASRock Arc A380 – Intel 31.0.101.3491 – Resizable BAR: OFF |
| 714 (avg FPS: 12) Intel UHD Graphics 770 – Intel 31.0.101.1371 |
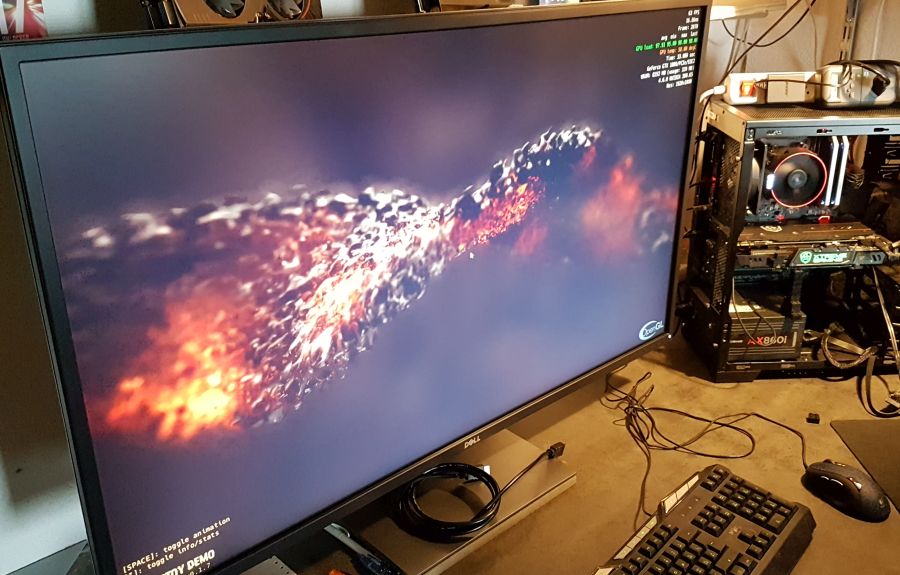
4.8 – Rhodium LC
Rhodium LC (LC for Liquid Carbon!) is a new GPU pixel shader benchmark made with GeeXLab and based on this shadertoy demo. You can download RhodiumLC from THIS PAGE.
P1080 (1920×1080)
| 5740 (avg FPS: 95) ASUS TUF Radeon RX 6800 XT OC 16GB – Adrenalin 20.12.2 |
| 4853 (avg FPS: 80) ASUS ROG Strix GeForce RTX 2080 OC 8GB – GeForce 416.94 |
| 3905 (avg FPS: 65) GIGABYTE GeForce RTX 3060 Ti Gaming OC 8G – GeForce 460.79 |
| 2835 (avg FPS: 47) EVGA GeForce GTX 1070 FTW – GeForce 416.94 |
| 2773 (avg FPS: 46) ASUS Strix Radeon RX 5700 – Adrenalin 20.12.2 |
| 1923 (avg FPS: 32) EVGA GeForce GTX 1060 SC 6GB – GeForce 416.94 |
| 1755 (avg FPS: 29) SAPPHIRE Radeon RX 5500 XT Pulse – Adrenalin 20.01.3 |
| 1719 (avg FPS: 28) ASRock Arc A380 – Intel 31.0.101.3491 |
| 1484 (avg FPS: 24) MSI GeForce GTX 970 – GeForce 416.94 |
| 1192 (avg FPS: 19) MSI Radeon RX 470 8GB – Adrenalin 18.11.1 |
| 303 (avg FPS: 5) Intel UHD Graphics 770 – Intel 31.0.101.1371 |
5 – Burn-in Test
The burn-in test has been done with the new version of FurMark (that will be released shortly). This version of FurMark is 64-bit and uses OpenGL or Vulkan API. The FurMark Vulkan version produced best results (higher temperature and power consumption) with the Arc A380.
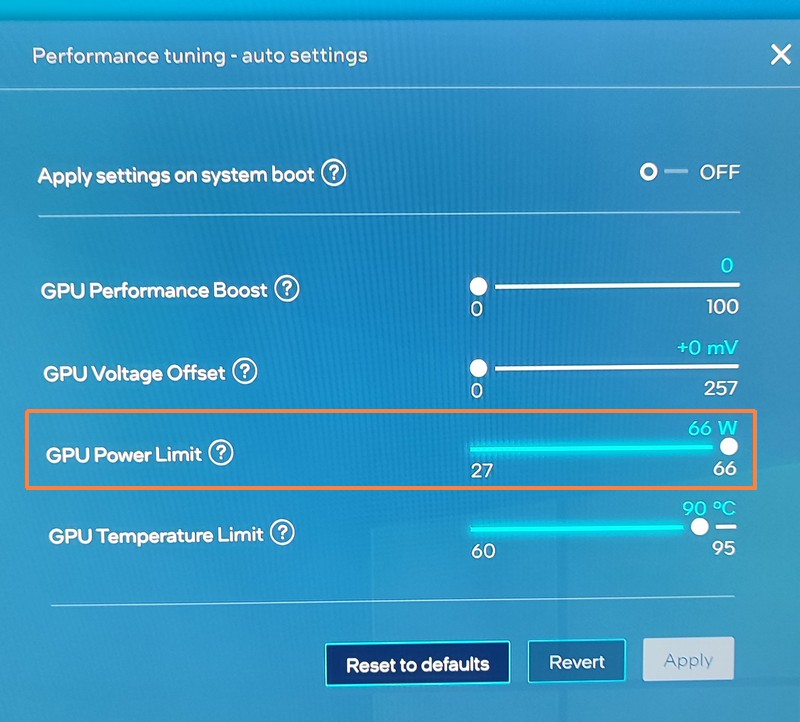
In Arc control center you can tune some parameters like the GPU Power Limit. By default, the GPU Power Limit is set to 55W. For the test, I set the value to the max: 66W.
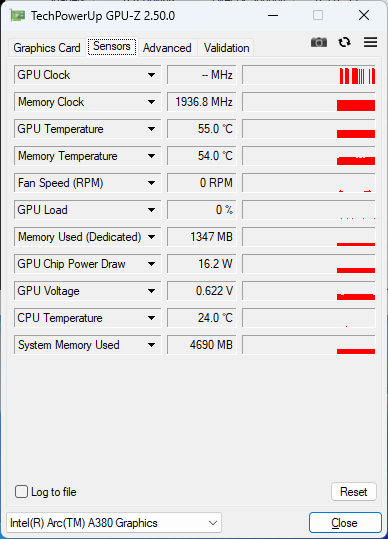
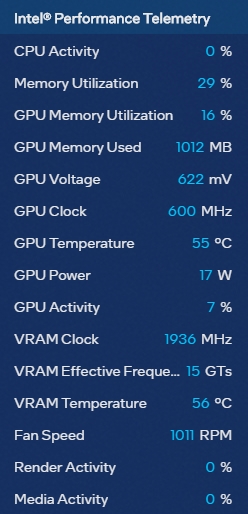
Idle state
– total power consumption of the testbed: 68W
– GPU temperature: 55°C
– GPU chip power draw: 17W
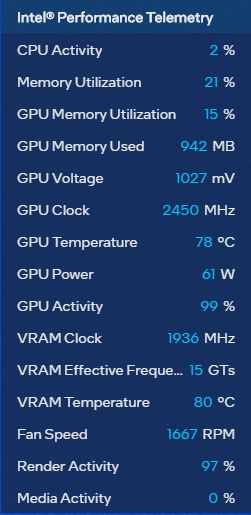
Stress test
– total power consumption of the testbed: 147W (CPU usage less than 2%)
– GPU temperature: 78°C
– GPU chip power draw: 61W
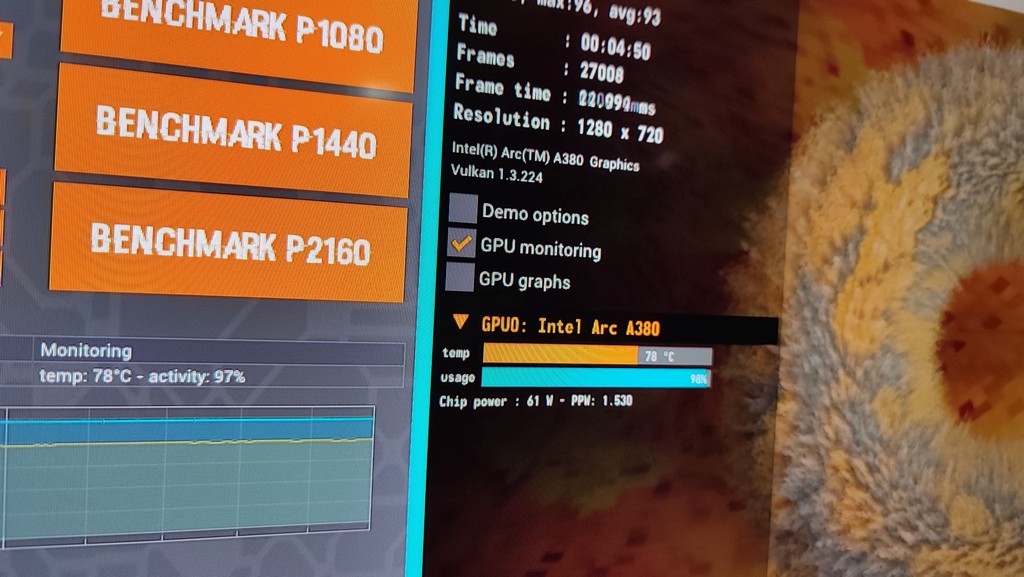
I stressed the Arc A380 during 10 minutes at a 1280×720 resolution. I barely heard the fan of the VGA cooler during the stress test. ASRock did a good job on the cooling system. With a CPU usage less than 1%, the difference of power consumption between idle and load state is due to the Arc A380 board: (147-68) * 0.9 = 71W (where 0.9 is the PSU efficiency factor). We are near the TBP (total board power) of the specifications.
6 – Conclusion
Yeah, even if it’s an entry level graphics card, I tested a real Intel discrete graphics card!!! The Arc A380 is the first desktop GPU launched by Intel and I must say, this card works fine. This small GPU has many modern features like hardware ray tracing, XeSS (Intel super sampling technology, the equivalent to NVIDIA DLSS or AMD FSR). Okay since it’s a small GPU the card is not a graphics beast but it can run all of games or 3D applications (in the latest 3DMark, the Arc A380 can run all tests except those that require more than 6GB of VRAM). Latest versions of OpenGL (4.6), Vulkan (1.3) and Direct3D (12 Ultimate) are all supported and for graphics developers, this is important (all my GeeXLab Vulkan ray tracing demos work correctly). Great for a $150 graphics card.
Depending on the tests, the resizable BAR can bring a important boost of performance. So, if your motherboard supports this feature, you should enable it in the BIOS. For example, the resizable BAR improves performances in Unigine Superposition, 3DMark Port Royal or XeSS test (in this test the boost is impressive).
ASRock VGA cooler works fine and the hybrid mode is perfect: passive mode for light graphics workloads, active mode for heavy graphics workloads.
The presence of a 8-pin power connector is a mystery. I hope it’s because ASRock knows the power consumption of the card can exceed 75W in some situations: the card has a factory-overclocked GPU (+450MHz) that could explain an additional power connector, but in that case why not a 6-pin one? For me it’s not a problem, my PSUs have enough 6-pin and 8-pin connectors but in some budget systems, the 8-pin connector can be an issue.
I hope Intel will continue to improve its graphics driver (and reduce its size by the way, more than 1.3GB for a driver is a bit too much!), because hardware without good software is worth nothing! Arc GPUs are new and Arc graphics drivers are not mature. So performances of the A380 will probably increase a bit in the future.
Final words: welcome Intel to the world of discrete graphics cards! A new competitor is always a good thing.