GeeXLab, the successor of GLSL Hacker, comes with the support of Direct3D 12. It’s not a full support but most of the basic things are available: command lists (CL), pipeline state objects (PSO), constant buffers (CB) and HLSL shaders.
An introduction to Direct3D programming with GeeXLab is available HERE.
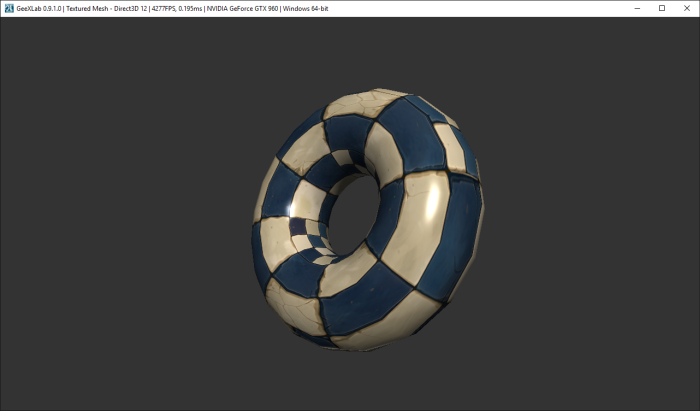
Since GeeXLab is now available with an OpenGL and a Direct3D 12 renderers, here is a quick benchmark that shows the difference of performance between Direct3D 12 and OpenGL 3.2 in a very simple scene: a phong-textured mesh (a torus to be original) is rendered with various polygon density. This test uses one command list, one PSO, one HLSL program, one mesh and one texture.
You can download both GeeXLab (version 0.9.3.0+ is recommended) and the test from THIS PAGE. The test is available in the host_api/Direct3D12_vs_OpenGL/ folder of the code sample pack (files: 09-lighting-mesh-d3d12.xml and 09-lighting-mesh-gl32.xml).
You can change the number of polygons by editing the source code of both files: lines 76-84 (09-lighting-mesh-d3d12.xml) and 47-54 (09-lighting-mesh-gl32.xml).
The results of this test should be taken with caution because it’s my first implementation of a Direct3D 12 plugin for GeeXLab and graphics drivers are also constantly updated. I will update this post as soon as I find bugs or bring some optimizations in GeeXLab that can change the results.
Testbed:
- CPU: Intel Core i5 6600K @3.5GHz
- Motherboard: ASUS Z170 Pro Gaming
- RAM: 8GB DDR4 Corsair Vengeance
- OS: Windows 10 64-bit
- Drivers:
- Radeon R9 290X: Catalyst 15.10 beta
- GeForce GTX 970: R358.50
- HD Graphics 530: v4279
Clock speeds: stock values for the CPU, memory and graphics cards.
The FPS in the following tables are the average framerates.
Direct3D 12 results
| Triangles | AMD Radeon R9 290X (avg FPS / GPU load) |
NVIDIA GeForce GTX 970 (avg FPS / GPU load) |
Intel HD Graphics 530 (avg FPS) |
| 800 | 9100 / 40% | 5500 / 25% | 1360 |
| 5’000 | 8200 / 45% | 5300 / 35% | 1220 |
| 20’000 | 5800 / 60% | 5100 / 45% | 1100 |
| 80’000 | 2400 / 80% | 2600 / 70% | 850 |
| 320’000 | 720 / 90% | 700 / 85% | 500 |
| 500’000 | 480 / 98% | 480 / 90% | 400 |
| 2’000’000 | 130 / 100% | 130 / 97% | 160 |
OpenGL 3.2 results
| Triangles | AMD Radeon R9 290X (avg FPS / GPU load) |
NVIDIA GeForce GTX 970 (avg FPS / GPU load) |
Intel HD Graphics 530 (avg FPS) |
| 800 | 4600 / 25% | 3700 / 35% | 1220 |
| 5’000 | 4300 / 25% | 3600 / 35% | 1160 |
| 20’000 | 4200 / 25% | 3600 / 36% | 1060 |
| 80’000 | 4100 / 30% | 3600 / 58% | 840 |
| 320’000 | 4100 / 46% | 2800 / 87% | 500 |
| 500’000 | 3200 / 70% | 2200 / 90% | 420 |
| 2’000’000 | 1000 / 100% | 930 / 95% | 180 |
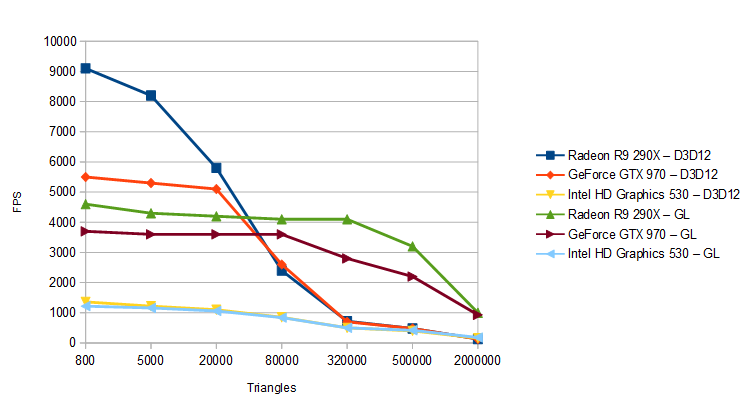
According to this test, Direct3D 12 is faster than OpenGL when the number of triangles is low. AMD Radeon cards are particularly fast! Around 80K polygons, Direct3D offers the same kind of performance than OpenGL. Above 80K polygons, OpenGL is faster. The case of Intel GPU is interesting because it has more or less the same performances in D3D12 and GL. What’s more for a mesh of 2-million polygons, The Intel GPU is faster than a GTX 970 or a R9 290X in D3D12! It looks like for many polygons, there is a CPU-bottleneck somewhere in the D3D12 rendering pipeline that does not reflect the real power of GPUs.
The results are similar with latest drivers (R361.43 / Crimson 15.12).
I also did a simple draw stress test: a quad is rendered 100, 400 and 4000 times. No hardware instancing is used, each quad is rendered with its own draw call. I only tested on my dev system, with a GeForce GTX 960 + R361.43.
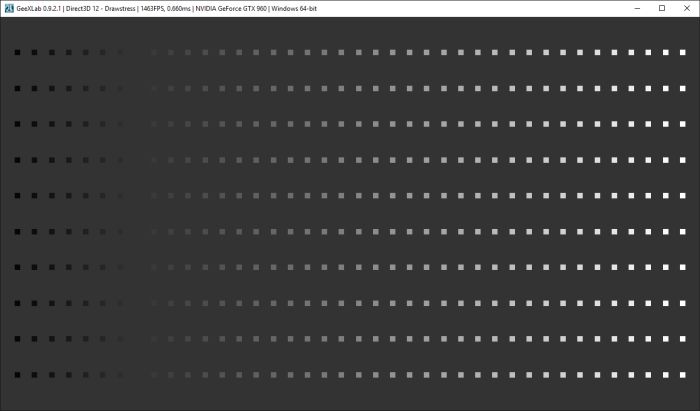
The test is available in the host_api/Direct3D12_vs_OpenGL/ folder of the code sample pack (files: 08-drawstress-d3d12.xml and 08-drawstress-opengl.xml).
In this test, a quad is made up of 4 vertices and 2 triangles.
To change the number of quads, edit the xml file and look for the lines:
quads = {x=10, y=10, size=10.0} -- 100 quads
--quads = {x=40, y=10, size=10.0} -- 400 quads
--quads = {x=100, y=40, size=10.0} -- 4000 quads
Direct3D 12
| Num quads | GeForce GTX 960 (R361.43) (avg FPS / GPU load) |
| 100 | 2900 / 20% |
| 400 | 1070 / 26% |
| 4000 | 180 / 20% |
OpenGL 3.2
| Num quads | GeForce GTX 960 (R361.43) (avg FPS / GPU load) |
| 100 | 1840 / 58% |
| 400 | 730 / 30% |
| 4000 | 97 / 20% |
GeeXLab is maybe not the best tool for this kind of test (a loop with 4000 iterations) because of the overhead of the virtual machine (Lua and host API functions calls). A C/C++ based test should be better. But this GeeXLab test shows that we can draw more objects with Direct3D 12 than with OpenGL. This is particularly visible with 4000 quads: D3D12 is twice faster: 180FPS for D3D12 against 97 FPS for OpenGL.
would something change if you use opengl 4.5? maybe some AZDO techniques could help?
August 3, 2009: OpenGL 3.2
Direct X 12: July 29, 2015
Vulkan: Not realsed yet
I don’t know how you send your triangles, but one improvement would be that you send more batches. If you just send one big command with the 2 millions triangles, the GPU will not appreciate it.
For example, some time ago there has been a commit in mesa by marek olsak to split the commands into smaller pieces for AMD GPUs.
I guess it is because the AMD (and NVidia) GPUs have numerous hardware thread dispatchers that can be used in that case, but they are not able to split the commands by themselves. Maybe the Intel one can do it.
Thank you very much for some interesting results, but I have to admit they are not very informative. Would you be so kind to add GPU working frequency instead of GPU load (or as the addition to GPU load information)? As we all know, the drivers are very aggressive in reducing working frequencies as the workload decreases. Previously, there were power states (PS) that determined the frequencies and power consumption. Nowadays, the frequency is continuously changed even through the PS. If GPU utilization is low, the test is not very relevant since there is a bottleneck or underutilization.
Second, instead of FPS, using frame execution time is more informative information. Furthermore, there is no hardware (monitor) that can refresh its screen 9000 times per second. Is it a time-span between the beginning and the end of the frame execution, or between two consecutive frames? Is it a CPU or GPU time?
I wouldn’t go into deeper analysis before getting information on GPU frequencies during the tests execution and a distinguished CPU and GPU execution time. I’ll be very grateful for any additional information.
On my GTX980 Ti I’m getting lower scores with the heavier settings in both tests, compared to what you posted in the article. I too noticed, while running the scripts in GeexLab, that there is CPU load limitation on one or two cores. Since my CPU (6-core Xeon @ 3.5GHz) is of much older architecture — Westmere, compared to your Skylake, I think the IPC difference plays some role in this case.
Where comparision with DX11! And more – my DX9!…