Article index
- 1 – Overview
- 2 – Gallery
- 3 – GPU information
- 4 – Benchmarks
- 4.1 – 3DMark FireStrike
- 4.2 – 3DMark TimeSpy
- 4.3 – 3DMark Port Royal
- 4.4 – 3DMark DX Raytracing Test
- 4.5 – 3DMark Speed Way
- 4.6 – FurMark 2
- 4.7 – Rhodium LC
- 5 – Burn-in Test
- 6 – Conclusion
1 – Overview
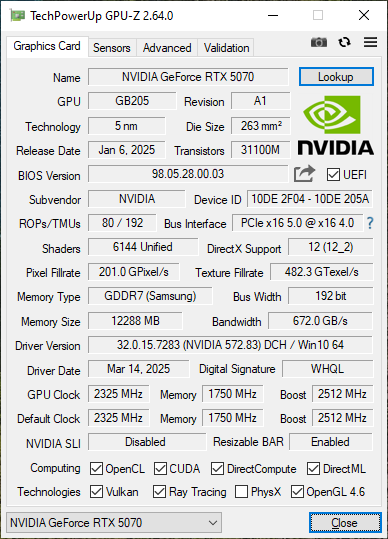
The GeForce RTX 5070 Founders Edition can be seen as the reference card since it’s the unique RTX 5070 card produced by NVIDIA. This card is the fourth member of the RTX 50 Series and is based on the GB205 GPU (Blackwell architecture). The graphics card is not overclocked and comes with reference core and memory clock speeds. As other RTX 50, the RTX 5070 uses the new GDDR7 graphics memory. The RTX 5070 does not use the full GB205 GPU: only 48 SMs (6144 cores) are enabled on the 50 available in the full implementation of the GB205 GPU (6400 cores).
Here are the specifications of the RTX 5070 Founders Edition:
- GPU: GB203-300, Blackwell architecture, TSMC 4nm 4N NVIDIA Custom Process, 31 billion transistors, base clock: 2325 MHz, boost clock: 2512 MHz
- CUDA cores: 6144
- Graphics Processing Clusters (GPCs): 5
- Texture Processing Clusters (TPCs): 24
- Streaming Multiprocessors (SMs): 48 (128 CUDA cores / SM)
- Tensor cores: 192 (5th generation – 4TC/SM)
- Ray tracing cores: 48 (4th generation)
- Texture units: 192
- ROPs: 80
- L2 cache size: 49152 kB
- FP32: 30.9 TFLOPS
- Max GPU temperature: 85°C
- Memory: 12GB GDDR7, 192-bit memory bus, bandwidth: 672 GB/sec
- DLSS: DLSS 4
- Total Power Consumption: 250W
- Power connectors: 12V-2×6
- Weight: 1.1 kg
- VGA cooler physical size: (24.3cm x 9.8cm x 4.0cm) or (9.55″ x 3.9″ x 1.55″)
- MSRP: USD $550
The RTX 5070 has been launched 3 weeks ago. But NVIDIA seems to be out of stock today (March 24, 2025).
In this review, we’ll compare the performance of the RTX 5070 with the RTX 4070 Ti, the RX 7900 XTX, the RX 7900 XT and the RX 6800 XT.
2 – Gallery
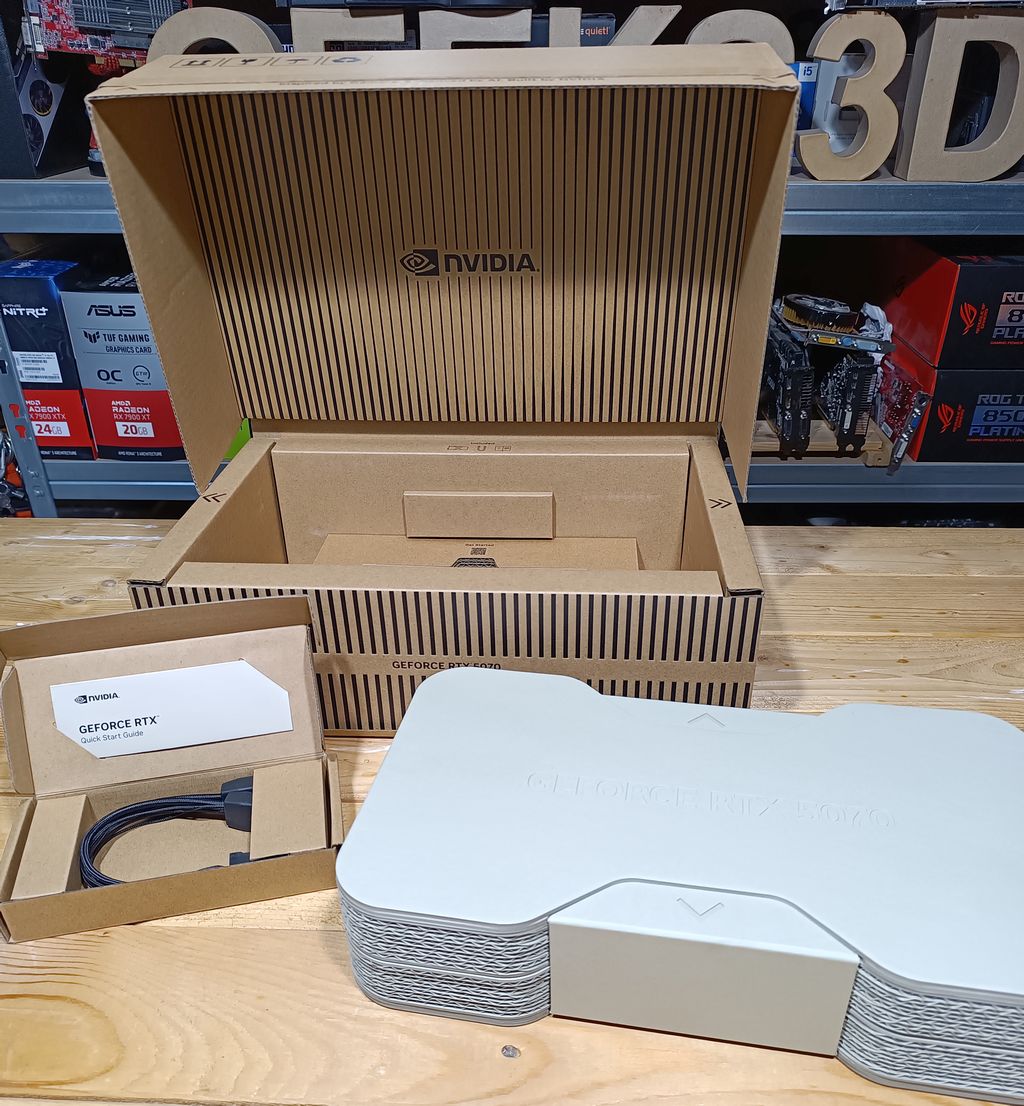
The bundle includes the following items:
– the RTX 5070 FE
– a two 8-pin to one 16-pin power adapter
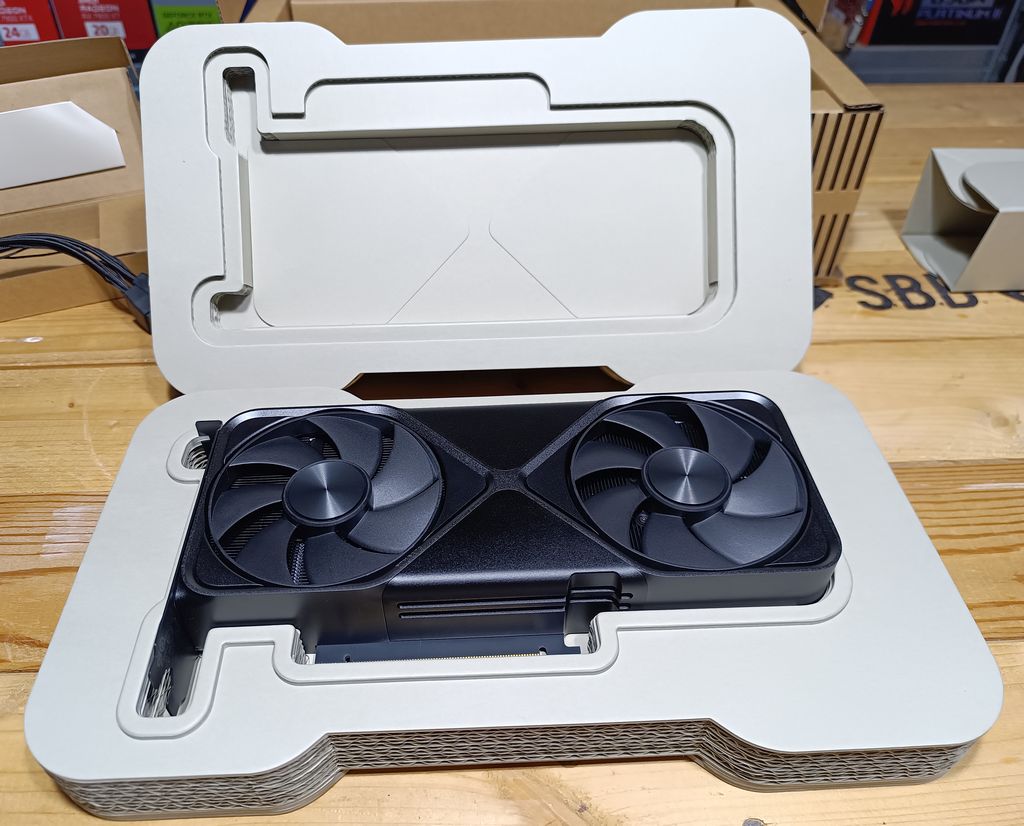
What I appreciate in this bundle is that the packaging is made up of 100% cardboard. No plastic! It’s fantastic! Maybe it’s greenwashing but less plastic is always good for our planet.
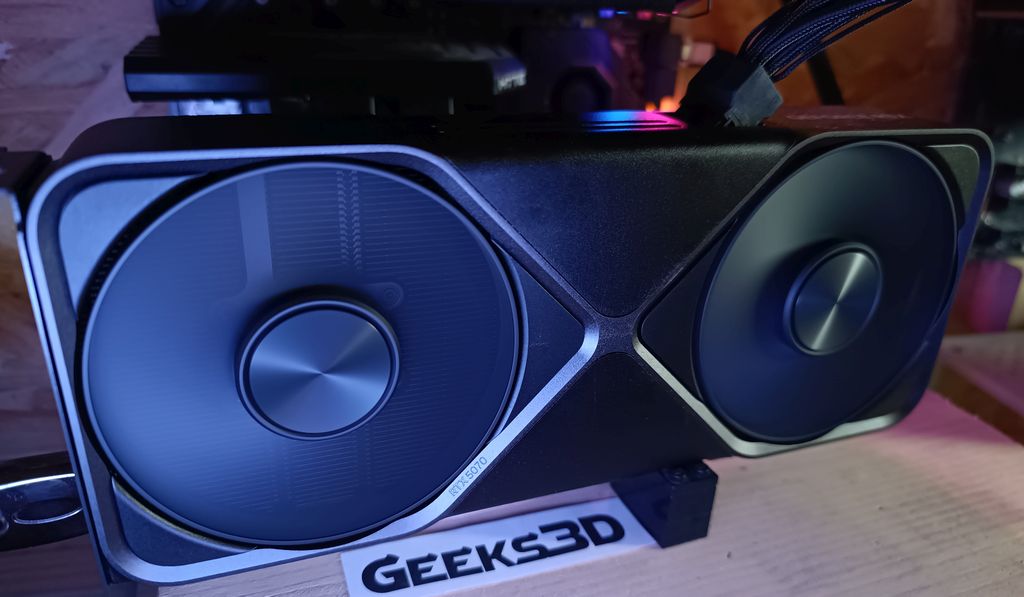
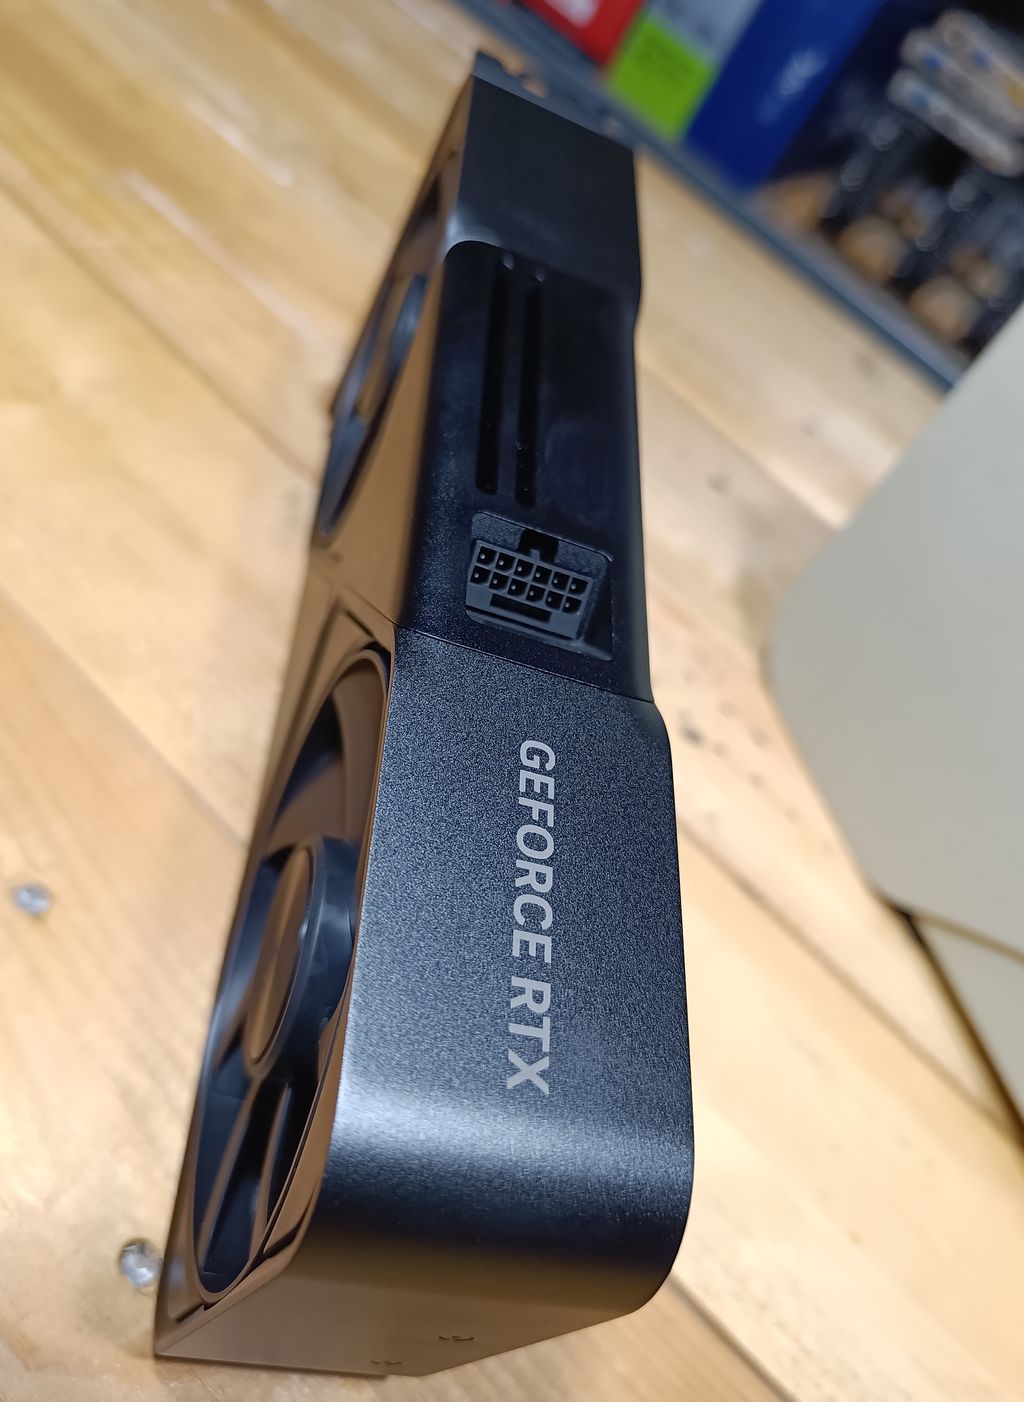
The RTX 5070 FE is a small (2 slots though, it’s SFF-Ready –SFF = Small Form Factor) and very neat graphics card. No RGB lighthing. The card embarks a 12V-2×6 power connector (RTX 5070 power draw is 250W) and the melted issues of the RTX 5090 should not happen here.
The 12V-2×6 (12VHPPWR) power connector.
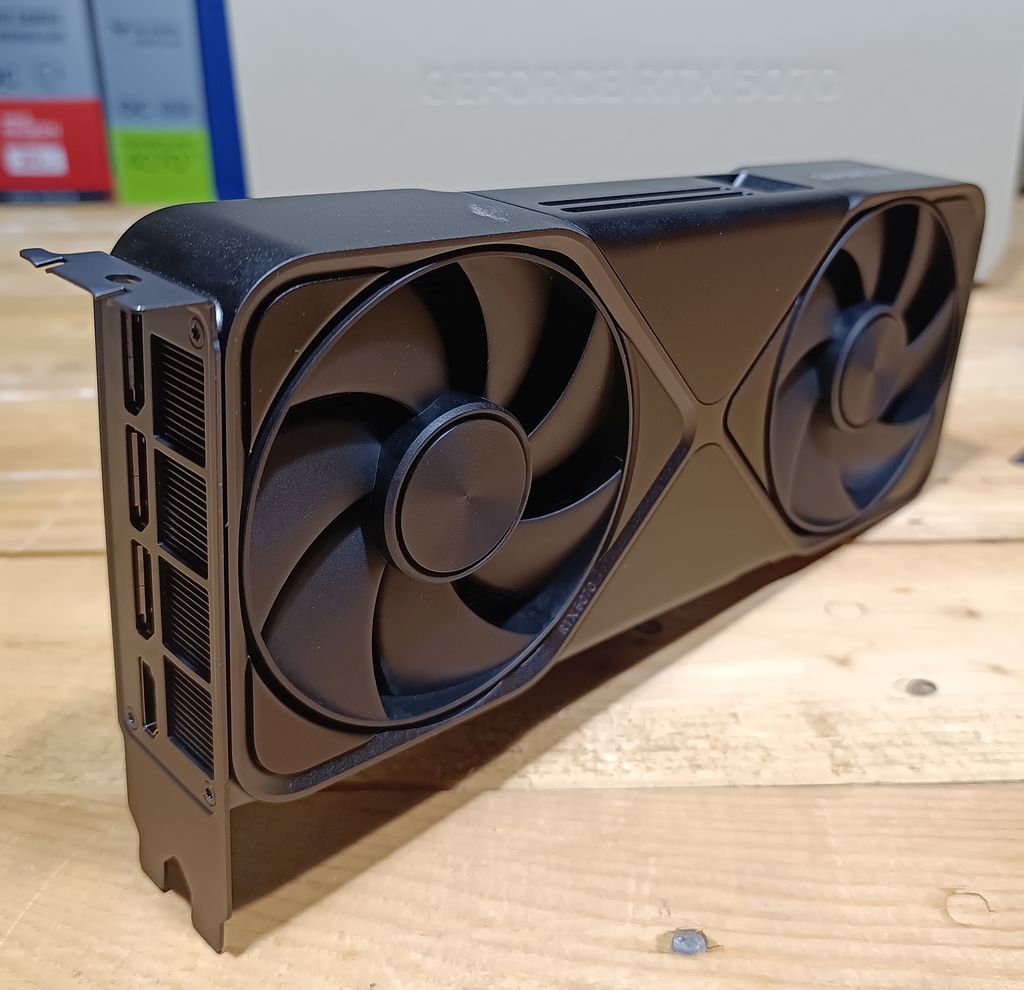
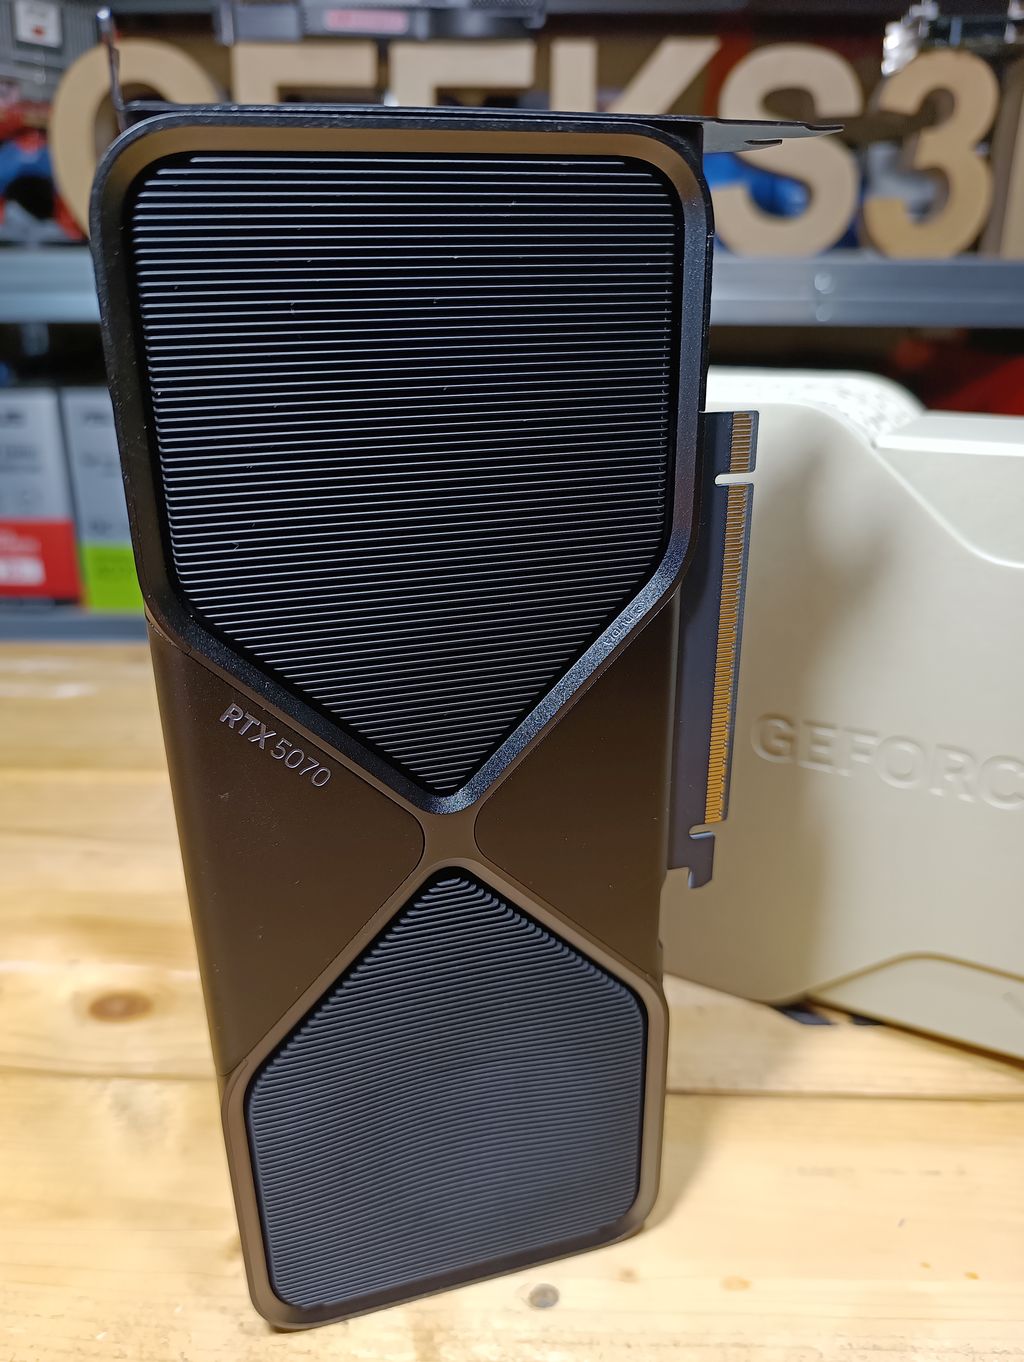
The rear side.
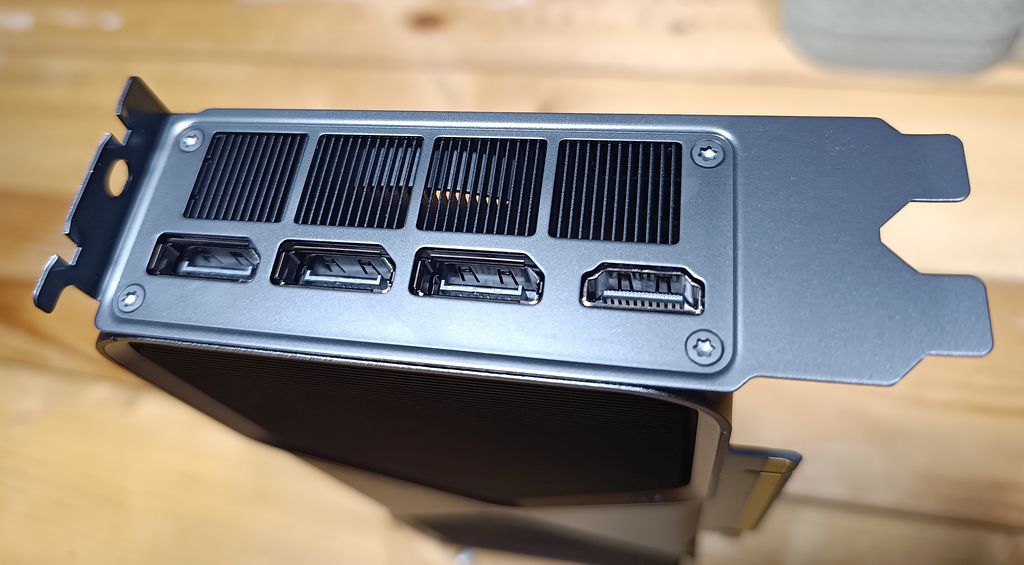
Three DisplayPort 2.1b (up to 8k @ 165Hz) and one HDMI 2.1a (up to 8k @ 120Hz). The RTX 5070 FE is the first card I saw with inverted output connectors… Why?
ASUS GeForce RTX 4070 Ti TUF vs RTX 5070 FE:

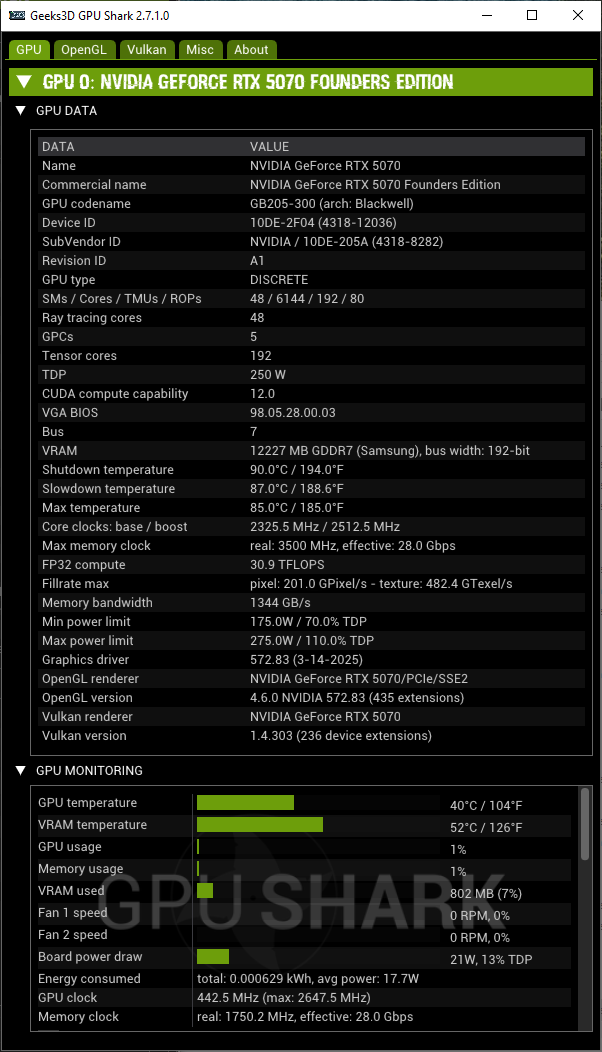
3 – GPU Information
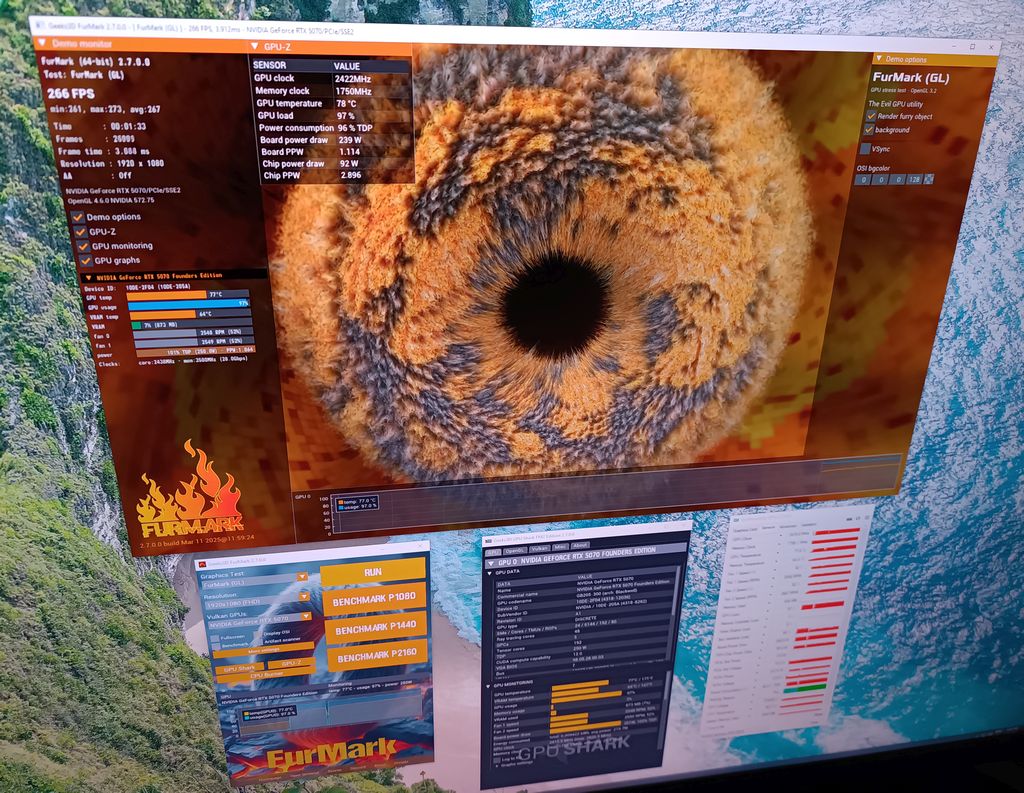
GPU data from the new GPU Shark 2:
GPU-Z screenshots.

4 – GPU Benchmarks
| GPU Test System | |
|---|---|
| CPU | AMD Ryzen 7 5800X |
| Motherboard | ASUS TUF X570-Plus |
| Memory | 16GB DDR4 Corsair Vengeance LED @ 3200MHz |
| PSU | ASUS Thor Platinum II 850W |
| Storage | Samsung 860 EVO 1TB SSD |
| Monitor | ASUS TUF VG289Q 4K |
| OS | Windows 10 22H2 64-bit |
| Graphics driver | GeForce 572.83 |
4.1 – 3DMark FireStrike
Fire Strike is a DirectX 11 benchmark for high-performance gaming PCs and overclocked systems. Fire Strike is very demanding, even for the latest graphics cards. If your frame rate is low, use Sky Diver instead.
Graphics test 1 has heavy tessellation and volumetric illumination. Graphics test 2 features complex smoke simulation using compute shaders on the GPU and dynamic particle illumination.
The Physics test runs 32 parallel simulations of soft and rigid body physics on the CPU.
The Combined test includes tessellation, illumination, smoke simulation and particles and post-processing on the GPU, while the CPU is tasked with running 32 parallel physics simulations.
Firestrike has a global score and three sub-scores (graphics, physics and combined). For this test, I compare the graphics score only.
| 77375 – SAPPHIRE Nitro+ Radeon RX 7900 XTX 24GB – Adrenalin 23.1.2 |
| 69209 – ASUS TUF Radeon RX 7900 XT 20GB – Adrenalin 23.2.2 |
| 56661 – NVIDIA RTX 5070 FE – GeForce 572.83 |
| 53903 – ASUS TUF RTX 4070 Ti 12GB OC – GeForce 528.49 |
| 48432 – ASUS TUF Radeon RX 6800 XT OC 16GB – Adrenalin 20.12.2 |
| 31431 – Intel Arc A750 LE – Intel 31.0.101.3793 – Resizable BAR: ON |
| 29130 – GIGABYTE GeForce RTX 3060 Ti Gaming OC 8G – GeForce 460.79 |
4.2 – 3DMark TimeSpy
Time Spy is a DirectX 12 benchmark with native support for new API features like asynchronous compute, explicit multi-adapter, and multi-threading.
Time Spy Graphics tests are rendered at 2560 × 1440 resolution.Graphics test 1 features lots of transparent content, particle shadows, and tessellation. Graphics test 2 features ray-marched volumetric illumination
with hundreds of lights and a large number of small particles.
Same thing, I took the graphics score only.
| 29930 – SAPPHIRE Nitro+ Radeon RX 7900 XTX 24GB – Adrenalin 23.1.2 |
| 25869 – ASUS TUF Radeon RX 7900 XT 20GB – Adrenalin 23.2.2 |
| 22263 – ASUS TUF RTX 4070 Ti 12GB OC – GeForce 528.49 |
| 21719 – NVIDIA RTX 5070 FE – GeForce 572.83 |
| 16294 – ASUS TUF Radeon RX 6800 XT OC 16GB – Adrenalin 20.12.2 |
| 12264 – Intel Arc A750 LE – Intel 31.0.101.3793 – Resizable BAR: ON |
| 10837 – GIGABYTE GeForce RTX 3060 Ti Gaming OC 8G – GeForce 460.79 |
| 10415 – ASUS ROG Strix GeForce RTX 2080 OC 8GB – GeForce 460.89 |
4.3 – 3DMark Port Royal
Port Royal is a graphics card benchmark for testing real-time ray tracing performance. To run this test, you must have a graphics card and drivers that support Microsoft DirectX Raytracing.
The test measures graphics card performance with a combination of real-time ray tracing and traditional rendering techniques. The scene features ray traced reflections, shadows (ray traced and shadow mapped), glass surfaces with ray traced reflections, volumetric lighting, particles, and post-processing effects. The rendering resolution is 2560 × 1440.
| 15816 | SAPPHIRE Nitro+ Radeon RX 7900 XTX 24GB – Adrenalin 23.1.2 |
| 13889 | ASUS TUF Radeon RX 7900 XT 20GB – Adrenalin 23.2.2 |
| 13859 | ASUS TUF RTX 4070 Ti 12GB OC – GeForce 528.49 |
| 13784 | NVIDIA RTX 5070 FE – GeForce 572.83 |
| 9149 | ASUS TUF Radeon RX 6800 XT OC 16GB – Adrenalin 20.12.2 |
| 6916 | GIGABYTE GeForce RTX 3060 Ti Gaming OC 8G – GeForce 460.79 |
| 6863 | ASUS ROG Strix GeForce RTX 2080 OC 8GB – GeForce 460.89 |
| 6512 | Intel Arc A750 LE – Intel 31.0.101.3793 – Resizable BAR: ON |
| 745 | ASRock Arc A380 – Intel 31.0.101.3491 – Resizable BAR: ON |
4.4 – 3DMark DX Raytracing Test
The DirectX Raytracing feature test measures pure ray-tracing performance. Use this test to compare the performance of dedicated ray-tracing hardware in the latest graphics cards.
In this feature test, there is a minimal amount of traditional rendering. The result of the test depends entirely on the ray-tracing performance of the graphics card.
Instead of using traditional rendering, the whole scene is ray-traced and drawn in one pass. Camera rays are traced across the field of view with small random offsets to simulate a depth of field effect. The frame rate is determined by the time taken to trace and shade a set number of samples for each
pixel (12 samples per pixel), combine the results with previous samples and present the output on the screen. The rendering resolution is 2560 × 1440.

| 66.85 FPS | ASUS TUF RTX 4070 Ti 12GB OC – GeForce 528.49 |
| 55.57 FPS | NVIDIA RTX 5070 FE – GeForce 572.83 |
| 51.86 FPS | SAPPHIRE Nitro+ Radeon RX 7900 XTX 24GB – Adrenalin 23.1.2 |
| 43.7 FPS | ASUS TUF Radeon RX 7900 XT 20GB – Adrenalin 23.2.2 |
| 28.78 FPS | Intel Arc A750 LE – Intel 31.0.101.3793 – Resizable BAR: ON |
| 27.43 FPS | >GIGABYTE GeForce RTX 3060 Ti Gaming OC 8G – GeForce 522.25 |
| 25.25 FPS | ASUS TUF Radeon RX 6800 XT OC 16GB – Adrenalin 22.10.1 |
| 21.5 FPS | ASUS ROG Strix GeForce RTX 2080 OC 8GB – GeForce 522.25 |
| 9 FPS | ASRock Arc A380 – Intel 31.0.101.3491 |
4.5 – 3DMark Speed Way
3DMark Speed Way is a graphics card benchmark for testing DirectX 12 Ultimate performance. To run this test, you must have a graphics card that supports DirectX 12 Ultimate and has 6GB or more of video memory.
Graphics test: the test measures graphics card performance with a combination of real-time ray tracing and traditional rendering techniques. The scene features ray traced reflections, real time global illumination, mesh shaders, volumetric lighting, particles and post-processing effects. The rendering resolution is 2560 × 1440.

| 6294 | SAPPHIRE Nitro+ Radeon RX 7900 XTX 24GB – Adrenalin 23.1.2 |
| 5692 | NVIDIA RTX 5070 FE – GeForce 572.83 |
| 5374 | ASUS TUF RTX 4070 Ti 12GB OC – GeForce 528.49 |
| 5290 | ASUS TUF Radeon RX 7900 XT 20GB – Adrenalin 25.3.1 |
| 3586 (avg FPS: 35.8) | ASUS TUF Radeon RX 6800 XT OC 16GB – Adrenalin 25.3.1 |
| 2970 (avg FPS: 29) | GIGABYTE GeForce RTX 3060 Ti Gaming OC 8G – GeForce 522.25 |
| 2320 (23.2 FPS) | Intel Arc A750 LE – Intel 31.0.101.3793 – Resizable BAR: ON |
| 2168 (avg FPS: 21) | ASUS ROG Strix GeForce RTX 2080 OC 8GB – GeForce 522.25 |
| 434 (avg FPS: 4) | ASRock Arc A380 6GB – Resizable BAR: ON – Intel 31.0.101.3491 |
4.6 – FurMark 2
FurMark 2 is a very intensive graphics benchmark and does not depend on the processing power of the CPU. So FurMark is a quick way to have an overview of the graphics performances of a GPU. OpenGL and Vulkan renderers are available.
4.6.1 – OpenGL Benchmark
P1080 (1920×1080)
| 21692 (361 FPS) | SAPPHIRE Nitro+ Radeon RX 7900 XTX 24GB – Adrenalin 25.3.1 |
| 17520 (292 FPS) | ASUS TUF Radeon RX 7900 XT 20GB – Adrenalin 25.3.1 |
| 17179 (286 FPS) | ASUS TUF RTX 4070 Ti 12GB OC – GeForce 572.83 |
| 16708 (278 FPS) | NVIDIA RTX 5070 FE – GeForce 572.83 |
| 15716 (261 FPS) | ASUS TUF Radeon RX 6800 XT OC 16GB – Adrenalin 25.3.1 |
| 8515 (141 FPS) | Intel Arc A750 LE – Intel 32.0.101.6651 – Resizable BAR: ON |
| 8167 (136 FPS) | GIGABYTE RTX 3070 Ti Gaming OC 8G – GeForce 572.83 |
P1440 (2560×1440)
| 16183 (269 FPS) | SAPPHIRE Nitro+ Radeon RX 7900 XTX 24GB – Adrenalin 25.3.1 |
| 13095 (218 FPS) | ASUS TUF RTX 4070 Ti 12GB OC – GeForce 572.83 |
| 12307 (205 FPS) | NVIDIA RTX 5070 FE – GeForce 572.83 |
| 12277 (204 FPS) | ASUS TUF Radeon RX 7900 XT 20GB – Adrenalin 25.3.1 |
| 10887 (181 FPS) | ASUS TUF Radeon RX 6800 XT OC 16GB – Adrenalin 25.3.1 |
| 6180 (102 FPS) | GIGABYTE RTX 3070 Ti Gaming OC 8G – GeForce 572.83 |
| 5664 (94 FPS) | Intel Arc A750 LE – Intel 32.0.101.6651 – Resizable BAR: ON |
P2160 (3840×2160)
| 8333 (138 FPS) | SAPPHIRE Nitro+ Radeon RX 7900 XTX 24GB – Adrenalin 25.3.1 |
| 6833 (113 FPS) | ASUS TUF RTX 4070 Ti 12GB OC – GeForce 572.83 |
| 6528 (108 FPS) | ASUS TUF Radeon RX 7900 XT 20GB – Adrenalin 25.3.1 |
| 6358 (106 FPS) | NVIDIA RTX 5070 FE – GeForce 572.83 |
| 5633 (93 FPS) | ASUS TUF Radeon RX 6800 XT OC 16GB – Adrenalin 25.3.1 |
| 3279 (54 FPS) | GIGABYTE RTX 3070 Ti Gaming OC 8G – GeForce 572.83 |
| 2781 (46 FPS) | Intel Arc A750 LE – Intel 32.0.101.6651 – Resizable BAR: ON |
4.6.2 – Vulkan Benchmark
P1080 (1920×1080)
| 21706 (361 FPS) | SAPPHIRE Nitro+ Radeon RX 7900 XTX 24GB – Adrenalin 25.3.1 |
| 17666 (294 FPS) | ASUS TUF Radeon RX 7900 XT 20GB – Adrenalin 25.3.1 |
| 17715 (295 FPS) | ASUS TUF RTX 4070 Ti 12GB OC – GeForce 572.83 |
| 17568 (293 FPS) | NVIDIA RTX 5070 FE – GeForce 572.83 |
| 15162 (252 FPS) | ASUS TUF Radeon RX 6800 XT OC 16GB – Adrenalin 25.3.1 |
| 9365 (156 FPS) | GIGABYTE RTX 3070 Ti Gaming OC 8G – GeForce 572.83 |
P1440 (2560×1440)
| 15852 (264 FPS) | SAPPHIRE Nitro+ Radeon RX 7900 XTX 24GB – Adrenalin 25.3.1 |
| 13245 (220 FPS) | ASUS TUF RTX 4070 Ti 12GB OC – GeForce 572.83 |
| 12366 (206 FPS) | ASUS TUF Radeon RX 7900 XT 20GB – Adrenalin 25.3.1 |
| 12250 (204 FPS) | NVIDIA RTX 5070 FE – GeForce 572.83 |
| 10266 (171 FPS) | ASUS TUF Radeon RX 6800 XT OC 16GB – Adrenalin 25.3.1 |
| 6232 (103 FPS) | GIGABYTE RTX 3070 Ti Gaming OC 8G – GeForce 572.83 |
P2160 (3840×2160)
| 8125 (135 FPS) | SAPPHIRE Nitro+ Radeon RX 7900 XTX 24GB – Adrenalin 25.3.1 |
| 6522 (108 FPS) | ASUS TUF RTX 4070 Ti 12GB OC – GeForce 572.83 |
| 6269 (104 FPS) | ASUS TUF Radeon RX 7900 XT 20GB – Adrenalin 25.3.1 |
| 5937 (98 FPS) | NVIDIA RTX 5070 FE – GeForce 572.83 |
| 5211 (86 FPS) | ASUS TUF Radeon RX 6800 XT OC 16GB – Adrenalin 25.3.1 |
| 3011 (50 FPS) | GIGABYTE RTX 3070 Ti Gaming OC 8G – GeForce 572.83 |
4.7 – Rhodium LC
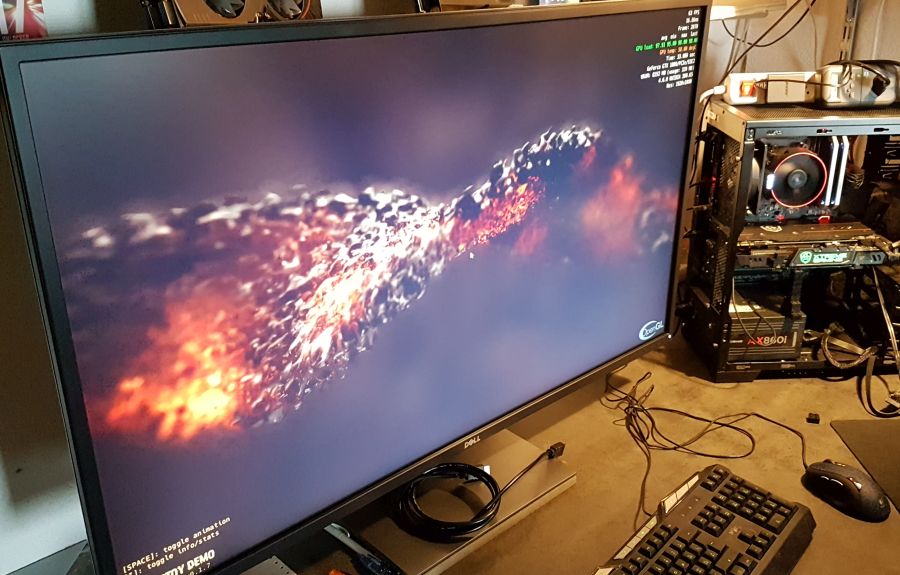
Rhodium LC (LC for Liquid Carbon!) is a GPU pixel shader benchmark made with GeeXLab and based on this shadertoy demo. You can download RhodiumLC from THIS PAGE.
OpenGL – P1080 (1920×1080)
| 17001 (283 FPS) | SAPPHIRE Nitro+ Radeon RX 7900 XTX 24GB – Adrenalin 25.3.1 |
| 12958 (215 FPS) | ASUS TUF Radeon RX 7900 XT 20GB – Adrenalin 25.3.1 |
| 8819 (146 FPS) | ASUS TUF RTX 4070 Ti 12GB OC – GeForce 572.83 |
| 7282 (121 FPS) | ASUS TUF Radeon RX 6800 XT OC 16GB – Adrenalin 25.3.1 |
| 7109 (118 FPS) | NVIDIA RTX 5070 FE – GeForce 572.83 |
| 6255 (104 FPS) | Intel Arc A750 LE – Intel 32.0.101.6651 – Resizable BAR: ON |
| 4853 (avg FPS: 80) | ASUS ROG Strix GeForce RTX 2080 OC 8GB – GeForce 416.94 |
| 4094 (avg FPS: 68) | GIGABYTE GeForce RTX 3060 Ti Gaming OC 8G – GeForce 526.98 |
OpenGL – P1440 (2560×1440)
| 9702 (161 FPS) | SAPPHIRE Nitro+ Radeon RX 7900 XTX 24GB – Adrenalin 25.3.1 |
| 7455 (124 FPS) | ASUS TUF Radeon RX 7900 XT 20GB – Adrenalin 25.3.1 |
| 4810 (80 FPS) | ASUS TUF RTX 4070 Ti 12GB OC – GeForce 572.83 |
| 4168 (69 FPS) | ASUS TUF Radeon RX 6800 XT OC 16GB – Adrenalin 25.3.1 |
| 4044 (67 FPS) | NVIDIA RTX 5070 FE – GeForce 572.83 |
| 3541 (59 FPS) | Intel Arc A750 LE – Intel 32.0.101.6651 – Resizable BAR: ON |
OpenGL – P2160 (3840×2160)
| 4214 (70 FPS) | SAPPHIRE Nitro+ Radeon RX 7900 XTX 24GB – Adrenalin 25.3.1 |
| 3248 (54 FPS) | ASUS TUF Radeon RX 7900 XT 20GB – Adrenalin 25.3.1 |
| 2242 (37 FPS) | ASUS TUF RTX 4070 Ti 12GB OC – GeForce 572.83 |
| 1865 (31 FPS) | ASUS TUF Radeon RX 6800 XT OC 16GB – Adrenalin 25.3.1 |
| 1835 (30 FPS) | NVIDIA RTX 5070 FE – GeForce 572.83 |
| 1592 (26 FPS) | Intel Arc A750 LE – Intel 32.0.101.6651 – Resizable BAR: ON |
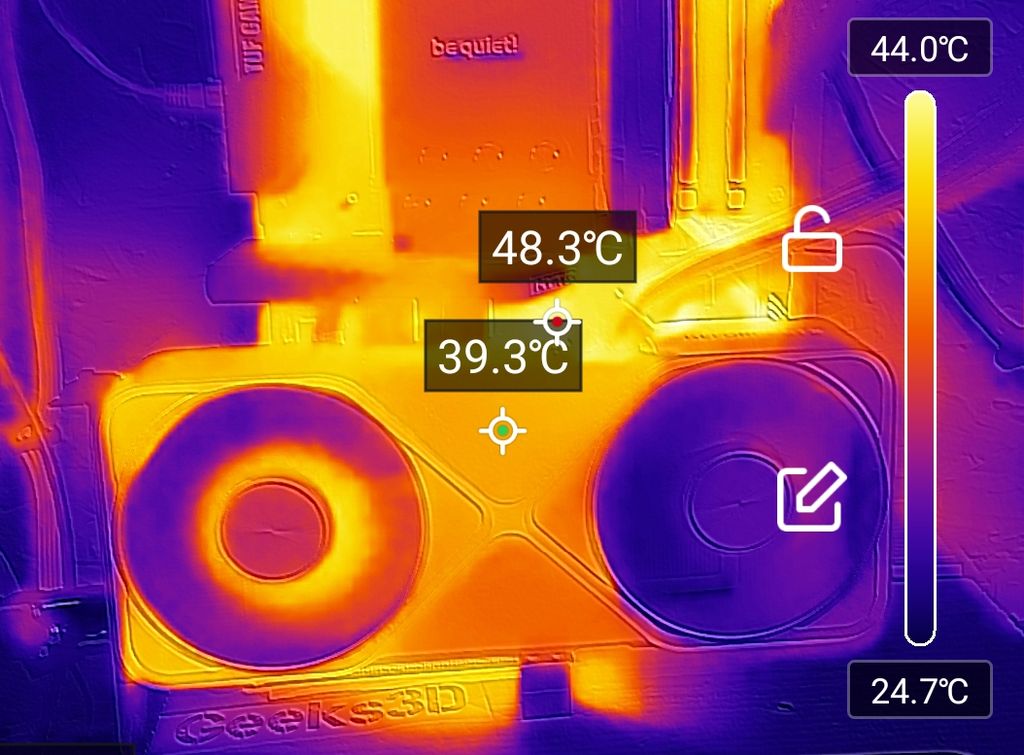
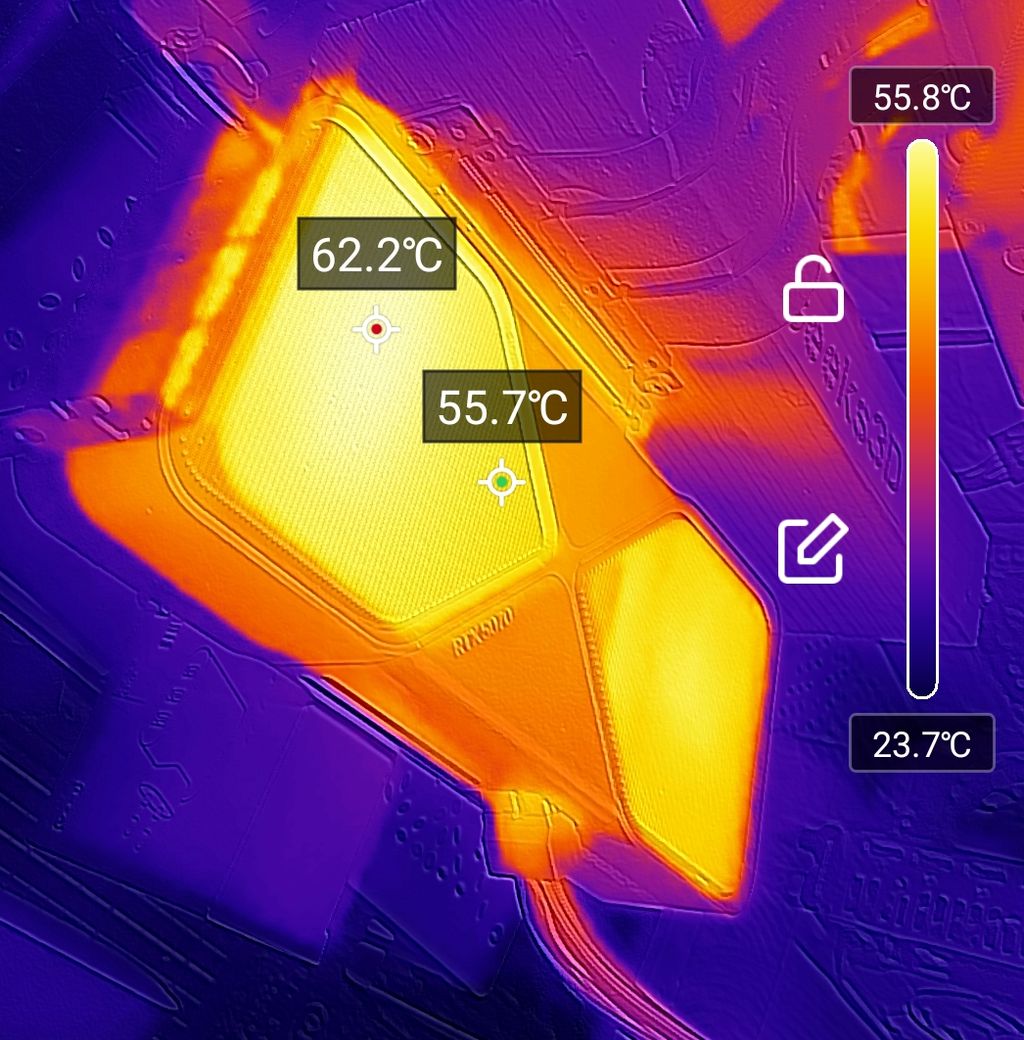
5 – Torture Test
The torture test has been done with FurMark 2. I used the Vulkan renderer for the stress test. I did two stress tests: the first one with the power limit target set to 100% (default mode in ASUS GPU Tweak III) and the second one set to +110% (OC mode in GPU Tweak).
Idle state
– total power consumption of the testbed: 76W
– GPU temperature: 36°C
– VRAM temperature: 48°C
– total graphics card: 15W
– GPU clock: 180 MHz
Stress test 1 – 1920×1080 – Vulkan – Default mode – GPU Power set to 100%, GPU boost clock: 2512 MHz
– total power consumption of the testbed: 340W
– GPU temperature: 77°C
– VRAM temperature: 70°C
– total graphics card: 250W
– GPU clock: 2340 MHz
– framerate: 284 FPS
Stress test 2 – 1920×1080 – Vulkan – OC mode – GPU Power set to 110%, GPU clock: 2532 MHz
– total power consumption of the testbed: 370W
– GPU temperature: 81°C
– VRAM temperature: 72°C
– total graphics card: 276W
– GPU clock: 2430 MHz
– framerate: 288 FPS
Stress test 3 – 1920×1080 – Vulkan – NVIDIA App automatic tuning – GPU Power set to 110%, GPU clock: 2650 MHz
– total power consumption of the testbed: 370W
– GPU temperature: 81°C
– VRAM temperature: 72°C
– total graphics card: 276W
– GPU clock: 2540 MHz
– framerate: 296 FPS
Stress test 3 – 1920×1080 – Vulkan – Manual overclocking – GPU Power set to 110%, GPU clock: 2853 MHz
– total power consumption of the testbed: 370W
– GPU temperature: 81°C
– VRAM temperature: 72°C
– total graphics card: 276W
– GPU clock: 2720 MHz
– framerate: 297 FPS
6 – Conclusion
The GeForce RTX 5070 Founders Edition is a nice graphics card with its industrial design and its metallic shroud. It’s a small card (it’s SFF-ready) compared to other high end models with bigger VGA cooler. RTX 5060 is around the corner, but today, at the time of writing, it’s the cheapest Blackwell GPU you can buy.
It’s a quick review. I tested the RTX 5070 with three tools only: 3DMark, FurMark 2 and RhodiumLC. According to these tests, the RTX 5070 is near the performances of Radeon RX 7900 XT and GeForce RTX 4070 Ti but with less power draw.
In pure pixel processing power (with RhodiumLC test), the RTX 5070 is behind the RTX 4070 Ti and RX 7900 XT. Even the RX 6800 XT is faster.
The RTX 5070 has only 12GB of graphics memory. Okay, it’s GDDR7 but 16GB would have been better if we consider the Radeon RX 9070 that has 16GB in XT and non-XT variants.
At idle state, the RTX 5070 FE is very quiet (fans are stopped) but under load, the fans are noisy. Not a big noise but you can hear them without problem.
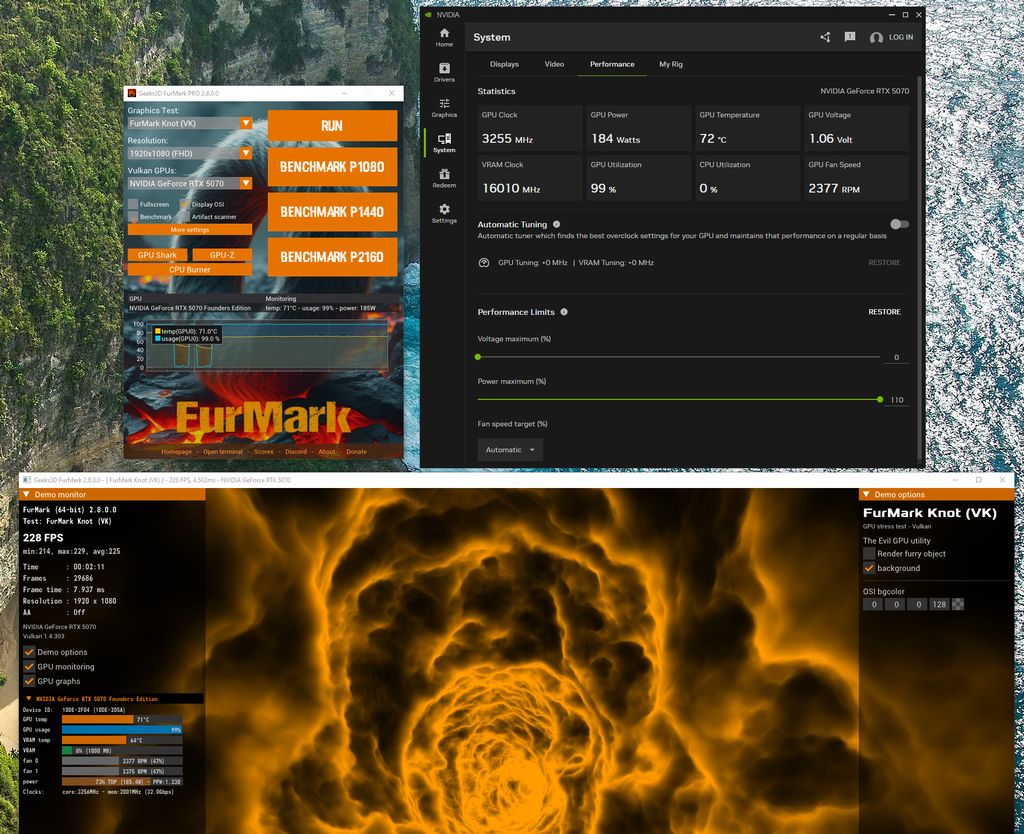
Overclocking on the RTX 5070 FE is incredible. I played with FurMark 2 and the cloudytunnel alone in Vulkan and I managed to push the GPU core clock to 3255 MHz!!! Okay, it’s a particular case, I think OC in real games will be lower. But the RTX 5070 has a lot of potential when it comes to overclocking.
A curious thing is the inversion of the output connectors. Not a big issue of course, but it’s worth noting it.
For developers, the RTX 5070 supports all modern graphics APIs (OpenGL 4.6, Vulkan 1.4, Direct3D 12), computing APIs (OpenCL, CUDA) and PhysX 5. It also supports gaming technologies like DLSS4.
Overclocking: core clock at 3255MHz.
Nvidia engineer explains the RTX 5090 launch: